85 Plus: Living Independently
Slide 1 of 14: Synopsis
Author
Catherine Robertson, Grossmont College
Synopsis
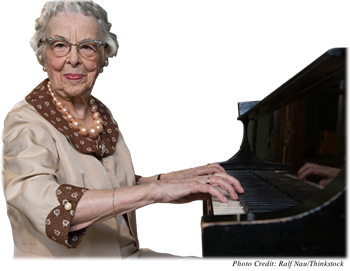
The fastest growing segment of our population is people over the age of 85, often referred to as the old-old. You may or may not know people of this age, so this activity will provide an in-depth look at some of those in this segment of the population. After an overview of this age group, you will meet three healthy, active people who are approaching their 100th year.
References
Baltes, P. (1998). Theoretical propositions of life span developmental psychology: On the dynamics between growth and decline. In M. Lawton (Ed.) Essential papers on the psychology of aging. New York: New York University Press.
Hitt, R., Young-Xu, Y., Silver, M., & Perts, T. (1999). Centenarians: The older you get, the healthier you have been. Lancet, 354, 652.
Hobbs, F., & Stoops, M. (2002) Demographic trends in the twentieth century. U.S. Department of Commerce, Economics and Statistics Administration, U.S. Census Bureau. Available at http://www.census.gov/prod/2002pubs/censr-4.pdf
National Institutes of Health (1999, June 16), NIH News Release. New Census Report shows exponential growth in number of Centenarians. Available at: http://www.nih.gov.news/pr/jun;99/nia-16.htm
Perlmutter, M., Kaplan, M., & Nyquist, L. (1990). Development of adaptive competence in adulthood. Human Development, 33, 185–197.
Slide 2 of 14: Introduction to the Old-Old
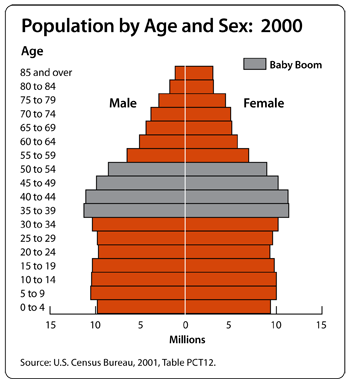
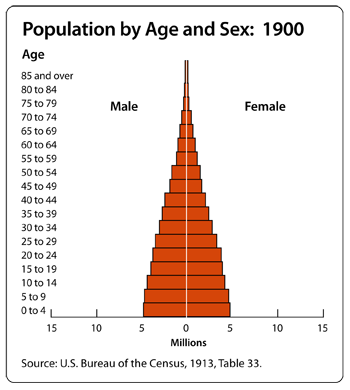
Today, people over 85 are the fastest growing segment of our population. Sometimes, they are collectively called the old-old. This term implies that the old-old are frail and dependent on others for support and services, but today, more and more people in their 80s and older live independent and involved lives.
Many factors contribute to the longevity of today’s old-old. New medications and medical breakthroughs have helped cure or control many conditions that once posed serious health risks. Genetics also play an important role in longevity as people who come from families whose members are long-lived may have longer lives themselves. Over time, these genetic tendencies have had more time to proliferate through the population.
Slide 3 of 14: Regions Known for Oldest Old Populations
In the 1970s, certain regions of the world, parts of Russia, Pakistan, and Peru, were recognized for having a larger-than-average number of centenarians, people who live to be over 100 years old. Some argued that because these regions had extensive rural communities that were more than 3,000 feet above sea level, the living environment was particularly suitable to a long life. Air pollution was minimal, and exercise and rural work life at this altitude may have enhanced heart fitness.
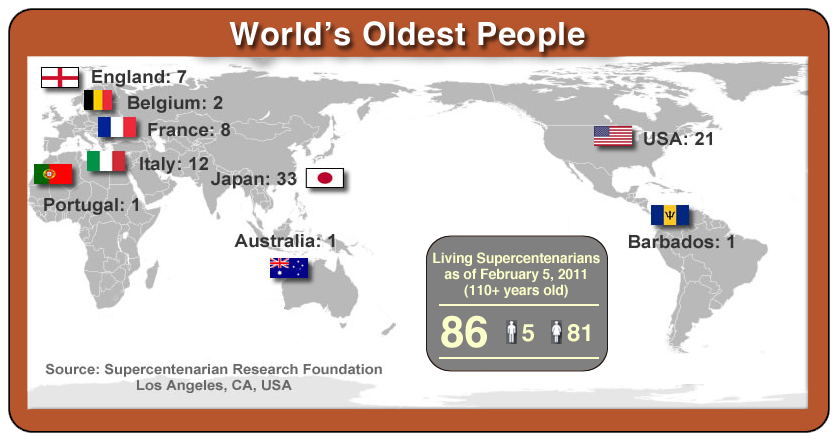
The authenticity of this data from the 1970s was subsequently called into question because of a lack of verifiable records. However, the idea of certain geographic areas being conducive to longevity is compelling. Study this map showing the location of the world’s supercentenarians, people who are over 110 years of age.
Elderly people in various regions of the world seem to share the following characteristics.
• They eat moderately, and their diet includes less meat and fat and more vegetables and herbs.
• They continue to work in some capacity into their senior years.
• They value family and community, and they have frequent interactions with several generations of their families. They are a vital part of their communities, and they are treated with respect.
• They exercise as well as relax regularly.
Consider this map showing the location of the world’s supercentenarians in 2011 in light of these 4 characteristics, and make a few notes on why living in certain regions might contribute to a long life. You will be asked to apply this information later in this activity.
Slide 4 of 14: Challenges for the Old-Old

Erik Erikson spoke of the struggle for integrity versus despair as the major task for people in this late stage of life. People who have achieved integrity are likely to feel content with their past and present lives while staying involved and engaged in life. Some gerontologists believe that people who remain actively involved with people and events around them are likely to have a long life.
People who maintain a firm but flexible identity appear to be best able to adjust to the challenges of aging. These people are more likely to adopt a coping strategy that is referred to as selective optimization with compensation. They may eliminate activities that they can no longer perform well and replace those activities with others that they can accomplish. An example is an elderly driver who is no longer confident driving on the freeway but can still drive comfortably to where he or she needs to go on local streets.
Slide 5 of 14: Meet Bernice
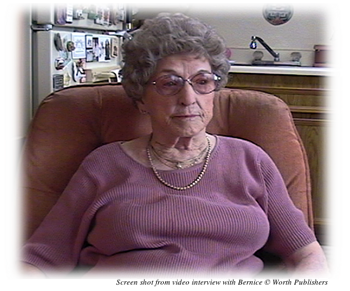
Bernice is a 93-year-old woman who lives alone in an apartment located in a seniors-only facility on the West Coast. She is active in the social life of her apartment complex and often visits with her neighbors. Bernice had no children, but she is very close to her niece and nephew and their families. Someone in the family takes her out to lunch three or four times a week. Her great-niece takes her to do her grocery shopping, errands, and banking twice a week. Bernice has friends who take her to lunch every month. Her family values her and her role as the matriarch because she has outlived everyone else in her generation.
Slide 6 of 14: Meet Bernice (continued)
- Chapters
- descriptions off, selected
- captions settings, opens captions settings dialog
- captions off, selected
- English Captions
This is a modal window.
Beginning of dialog window. Escape will cancel and close the window.
End of dialog window.
This is a modal window. This modal can be closed by pressing the Escape key or activating the close button.
This is a modal window.
Bernice has been a widow for more than 25 years. Although she misses her husband, she has adjusted well to being a widow. Bernice comes from a long-lived family. Her sisters recently passed away at ages 83 and 88, and her father lived to 82. Two other relatives lived to 94 and 97.
Bernice’s husband was a traveling salesman who was away for as long as six weeks at a time. This circumstance allowed Bernice to get used to being independent and doing things on her own. Bernice still pays all her bills without help. Although Bernice needs help with heavy cleaning, she still cooks for herself and maintains a healthy diet. She has preserved a positive attitude even though she went through a life-threatening illness and hospitalization five years ago.
Play the video to learn about Bernice’s personal experience as a person over the age of 85. Make some notes about what factors that you think contribute to Bernice’s longevity as you watch the video. You will want to refer to your notes later in this activity.
Slide 7 of 14: Meet Mary
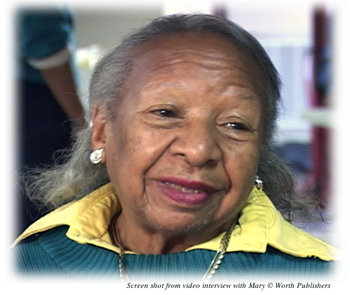
Mary is a 96-year-old woman who lives alone in the same apartment that she has rented since 1942. She has been busy all her life and has been working since she was 14 years old. Since she turned 80, she has tried to slow down a bit. She no longer works full time, but she volunteers three to five days a week, either working at her church’s soup kitchen and food pantry or teaching crafts at a senior center. She bounds up the four flights to her apartment with energy to spare. She does not need glasses, and amazingly, she hears as well as she did when she was in her twenties.
Slide 8 of 14: Meet Mary (continued)
- Chapters
- descriptions off, selected
- captions settings, opens captions settings dialog
- captions off, selected
- English Captions
This is a modal window.
Beginning of dialog window. Escape will cancel and close the window.
End of dialog window.
This is a modal window. This modal can be closed by pressing the Escape key or activating the close button.
This is a modal window.
Mary lost her husband about 15 years ago, but her most recent loss was her 55-year-old boyfriend, who died suddenly of a heart attack. She has had to grow accustomed to these frequent losses as she has outlived many of her age-mates and most of her seven siblings. Mary attributes her ability to persevere to her faith in God and her optimistic personality. She has always had a healthy diet, has never smoked, and only drinks to celebrate — like when she is on a cruise or on a winning run in Las Vegas.
Play the video to hear Mary’s personal experiences as someone over the age of 85. Make some notes about what factors contribute to Mary’s longevity as you watch the video. You will want to refer to them later in this activity.
Slide 9 of 14: Meet John

John will be 100 on his next birthday, and he does not seem to be either excited or worried about it. He lives in a graduated senior facility. At this time, John has his own room and lives independently. If he becomes ill or infirm, he could be transferred to another area of the facility where he would receive the needed care. John does have a hearing deficit, and he wears a hearing aid. He eats in the dining room and seems to enjoy the social aspect of mealtimes. His niece visits him occasionally.
Slide 10 of 14: Meet John (continued)
- Chapters
- descriptions off, selected
- captions settings, opens captions settings dialog
- captions off, selected
- English Captions
This is a modal window.
Beginning of dialog window. Escape will cancel and close the window.
End of dialog window.
This is a modal window. This modal can be closed by pressing the Escape key or activating the close button.
This is a modal window.
John has been a widower for quite some time. He seems to have adjusted very well to living alone. Before he retired at age 80, he bought and sold lumber for a company on the East Coast. He enjoyed traveling for his job, but he quit when traveling became too difficult for him. His parents both lived to be around 100, so he does not think living to that age is unusual.
John seems to enjoy his life. Since he lives in a senior-facility, he neither cooks his meals nor cleans his room. Since women tend to live longer than men, there are more women than men where he lives, and he is concerned about how older women are treated. He sees women in later adulthood being ignored, but he feels that they should be appreciated. He has a very positive attitude, which he demonstrates with frequent jokes and laughter.
Play the video to hear John’s personal experiences as someone over the age of 85. Make some notes about what factors contribute to his longevity as you watch the video. You will want to refer to them later in this activity.
Slide 11 of 14: Assessment: Check Your Understanding

Slide 12 of 14: Assessment: Check Your Understanding

Slide 13 of 14: Assessment: Check Your Understanding

Slide 14 of 14: Assessment: Check Your Understanding

Congratulations! You have completed this activity.Total Score: x out of x points (x%) You have received a provisional score for your essay answers, which have been submitted to your instructor.