
Chapter 1. Research Methods and Cognitive Aging
Synopsis
Research Methods and Cognitive Aging
Author
Thomas E. Ludwig, Hope College
S. Stavros Valenti, Hofstra University
Synopsis
This activity explores how various research methods have been employed to study how intelligence changes with age. After considering the efficacy of the various research models, this activity concludes with a discussion of new research findings on cognitive aging.
REFERENCES
Botwinick, J. (1977). Intellectual abilities. In J. E. Birren & K. W. Schaie (Eds.), Handbook of the psychology of aging (pp. 580-605). New York: Van Nostrand Reinhold.
Botwinick, J., & Seigler, I. C. (1980). Intellectual ability among the elderly: Simultaneous cross-sectional and longitudinal comparisons. Developmental Psychology, 16, 49-53.
Hertzog, C. (1996). Research design in studies of aging and cognition. In J. E. Birren & K. W. Schaie (Eds.), Handbook of the psychology of aging (4th ed., pp. 24-37). New York: Academic Press.
Park, D., & Gutchess, A. (2006). The cognitive neuroscience of aging and culture. Current Directions in Psychological Science, 15, 105-108.
Park, D. C., Lautenschlager, G., Hededen, T., Davidson, N., Smith, A. D., & Smith, P. K. (2002). Models of visuospatial and verbal memory across the adult life span. Psychology and Aging, 17, 299-320.
Schaie, K. W. (1994). The course of adult intellectual development. American Psychologist, 49, 304-313.
Schaie, K. W. (1965). A general model for the study of developmental problems. Psychological Bulletin, 64, 92-107.
Wechsler, D. (1972). “Hold” and “don’t hold” tests. In S. M. Chown (Ed.), Human aging (pp. 25-34). New York: Penguin.
Measuring Intelligence and Cognitive Function in Adulthood

Intelligence represents a complex intersection of cognitive functions, so any study of intelligence is inevitably an exploration of a multitude of cognitive abilities. You will examine some evidence from research on whether intelligence changes with age and how researchers have tried to measure such changes. The study of changes in adult intelligence and cognitive aging has progressed through several phases as the pendulum of opinion has swung from one extreme to the other throughout U. S. history.
The Army Alpha Test

Intelligence testing was first used on a large scale during World War I when U S Army researchers developed a paper-and-pencil IQ test called the Army Alpha Test. The Army gave this test to several hundred thousand new recruits as well as to thousands of career military men to determine whether they were better suited for officer training or for peeling potatoes. Although most of the soldiers who took the Army Alpha Test were in their late teens or early 20s, some were as old as 60.
In the years after World War I, researchers began studying the question of whether intelligence changes with age across the adult years. The first thing that they did was to go back to the Army Alpha Test to compare the scores from the various age groups. This is an example of a cross-sectional study, in which different age groups are tested at the same point in time.
Depressing Results
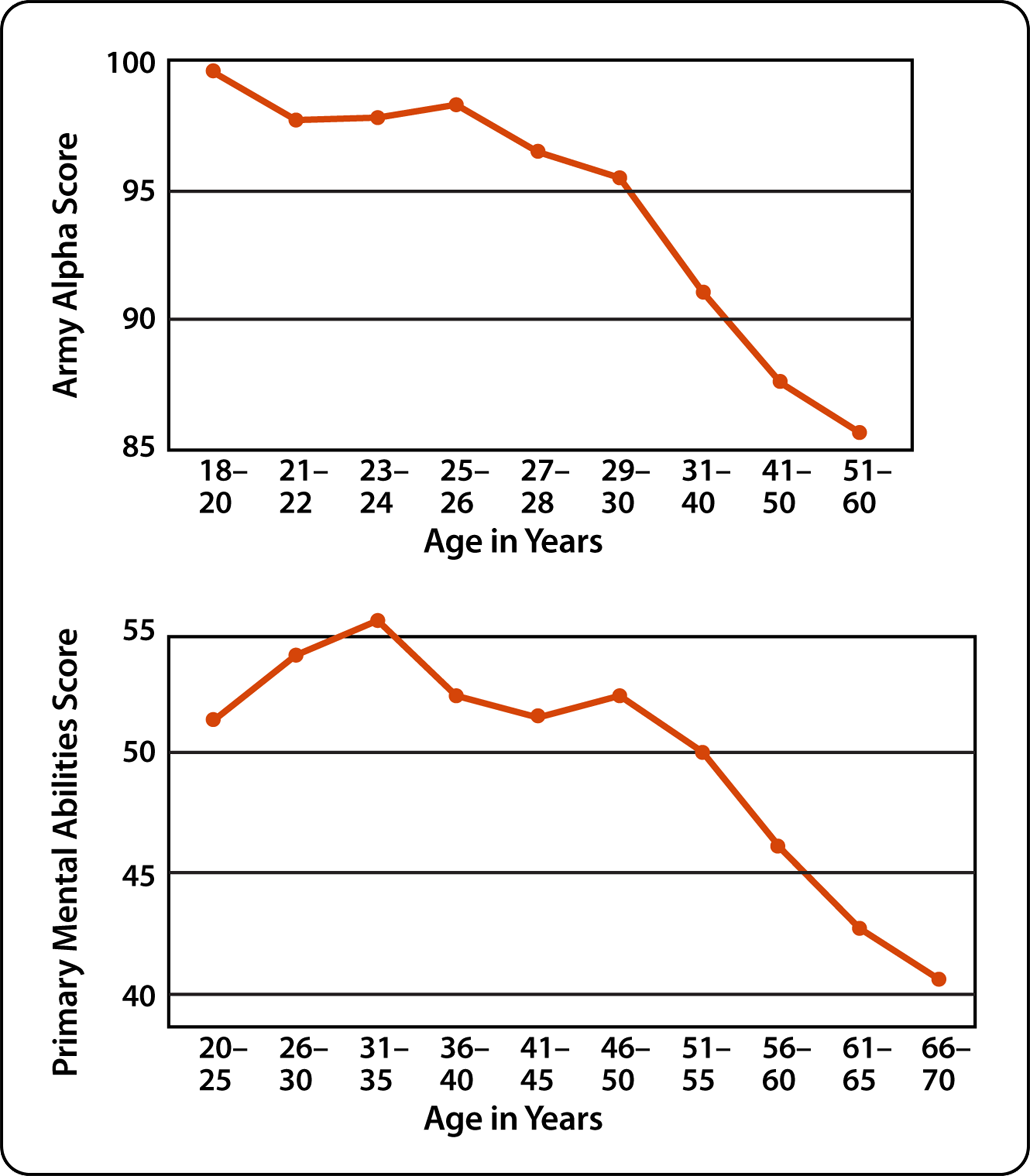
The standard scores on the Army Alpha Test for the various age groups are shown in the top graph. As you can see, men in their mid-20s performed much better than those in their 30s.
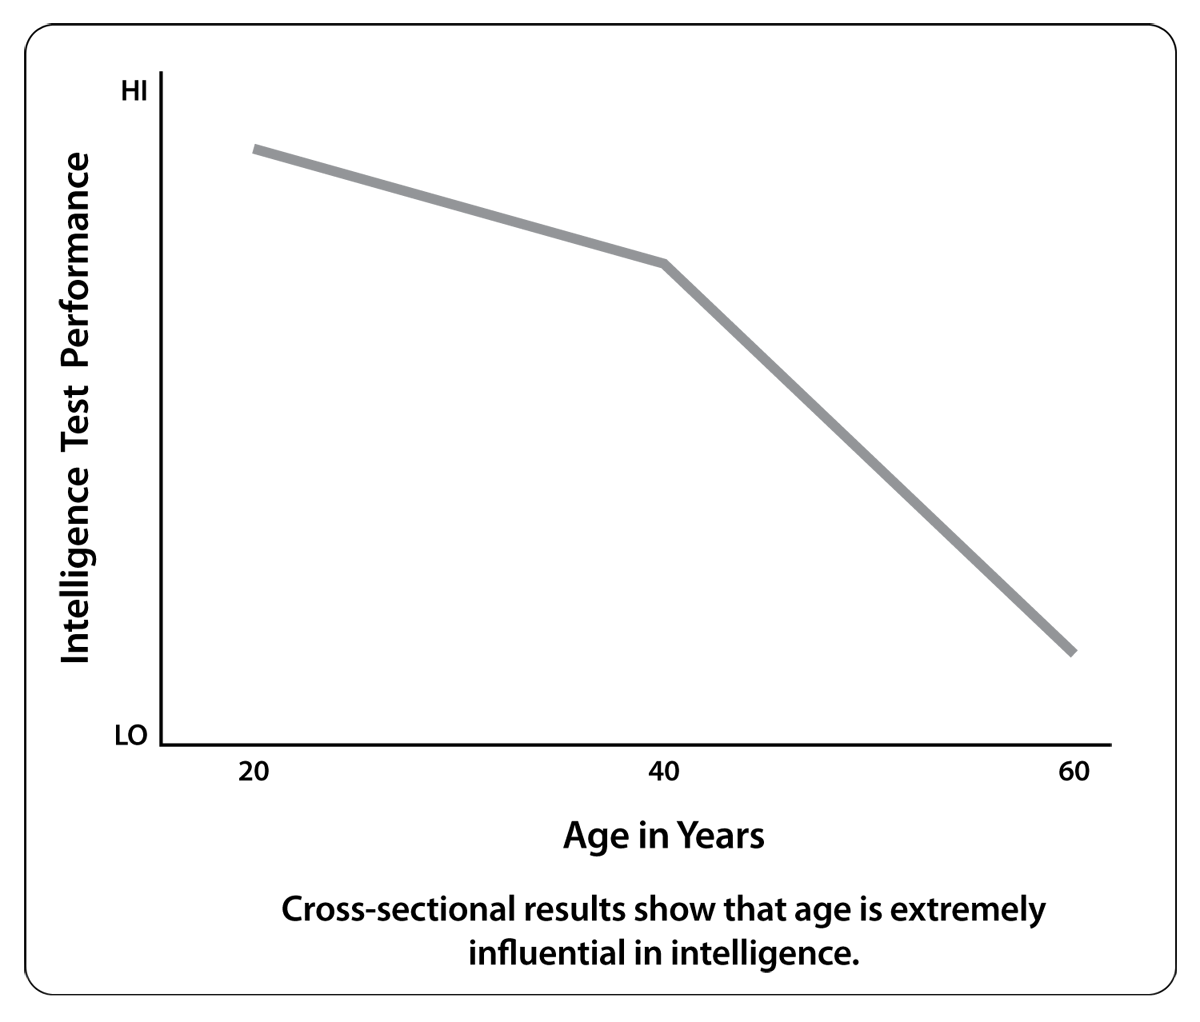
These results stimulated a boom in research on intelligence and aging. As the bottom graph shows, the pattern of results from these studies suggested that intellectual ability peaks during late adolescence or early adulthood and then declines steadily as shown in the bottom graph.
The picture looked bleak for older people. By the 1950s, hundreds of cross-sectional studies had been published on adult intelligence, and almost all of them showed a dramatic drop in intelligence after age 30 or 35. The results were so consistent that David Wechsler, a leading researcher, said in 1958, “Almost all human abilities show a progressive decline with age.”
Source:
Top graph: Jones, H.E. (1959). Intelligence and problem-solving. In J.E. Birren (Ed.). Handbook of aging and the individual. Chicago: Univ. of Chicago Press.
Bottom graph: Schaie, K.W. (1988). Variability in cognitive functioning in the elderly: Implications for societal participation. In A. Woodhead, M. Bender, & R. Leonard (Eds.), Phenotypic variation in populations: Relevance to risk management. New York: Plenum Press.
The Pendulum Swings from Pessimism to Optimism
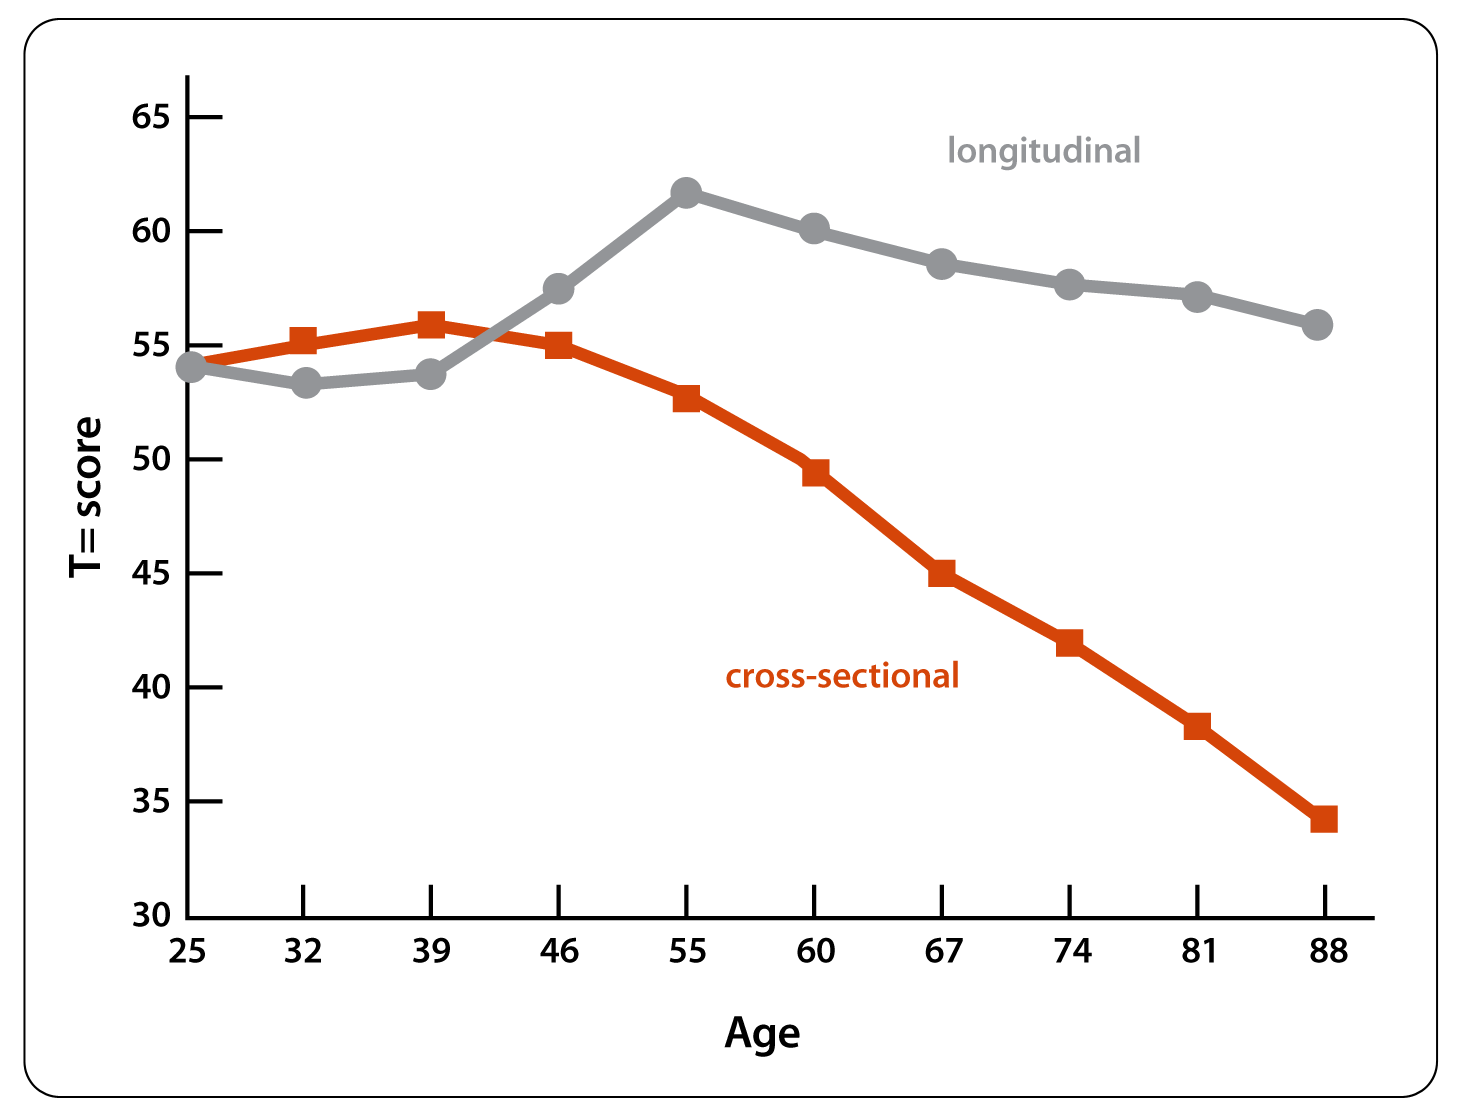
By the 1950s, some researchers had begun using longitudinal studies, a research method in which the same group of individuals is tested several times over a period of years. Studies of cognitive aging using this method showed a completely different pattern of results. IQ scores held steady or even improved through middle adulthood as shown in this graph that compares typical longitudinal results with typical cross-sectional study results.
The difference between the results from the two types of studies was dramatic and troubling. Which pattern represents the truth about intelligence and cognitive aging?
By the late 1960s, researchers thought that they had the answer. They had concluded that cross-sectional studies exaggerated the effects of aging, and they began to place more weight on the results from longitudinal studies. After all, even developmental researchers are afraid of growing old, so it is not surprising that the pendulum swung toward optimism with most researchers believing that intelligence holds steady or improves with age.
Source: (Schaie, 1988)
A Closer Look at Cross-Sectional Research

Why did researchers begin to believe that cross-sectional studies exaggerated the effects of aging on intelligence? Let’s examine what actually happens in research that uses a cross-sectional design.
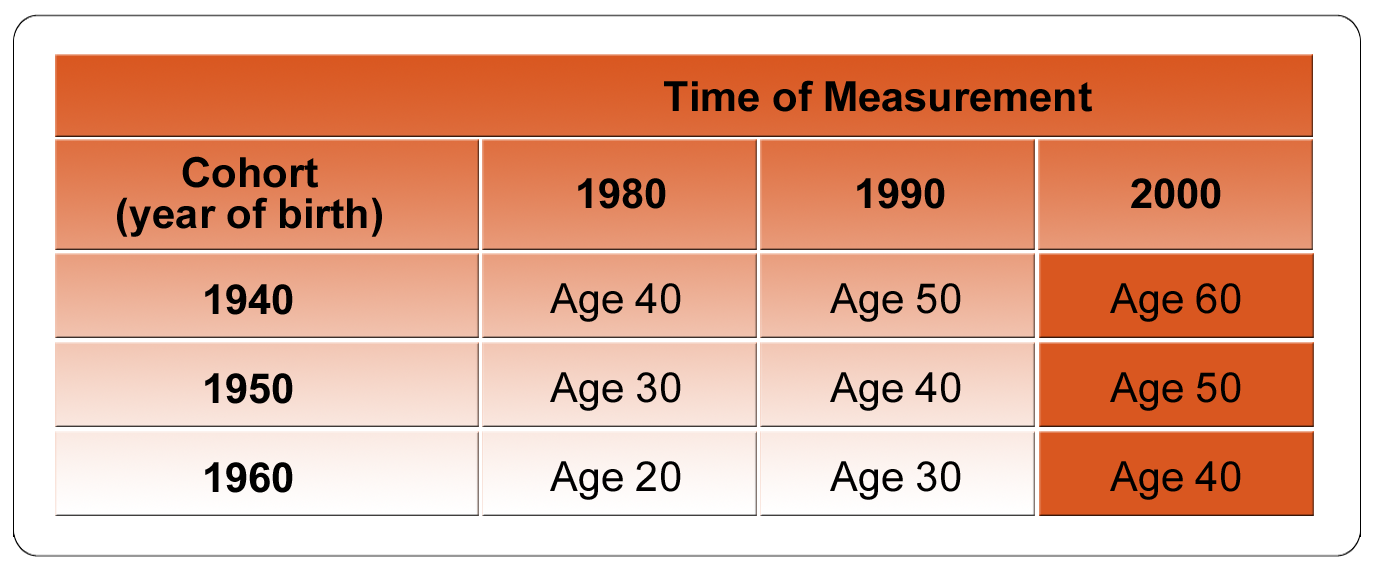
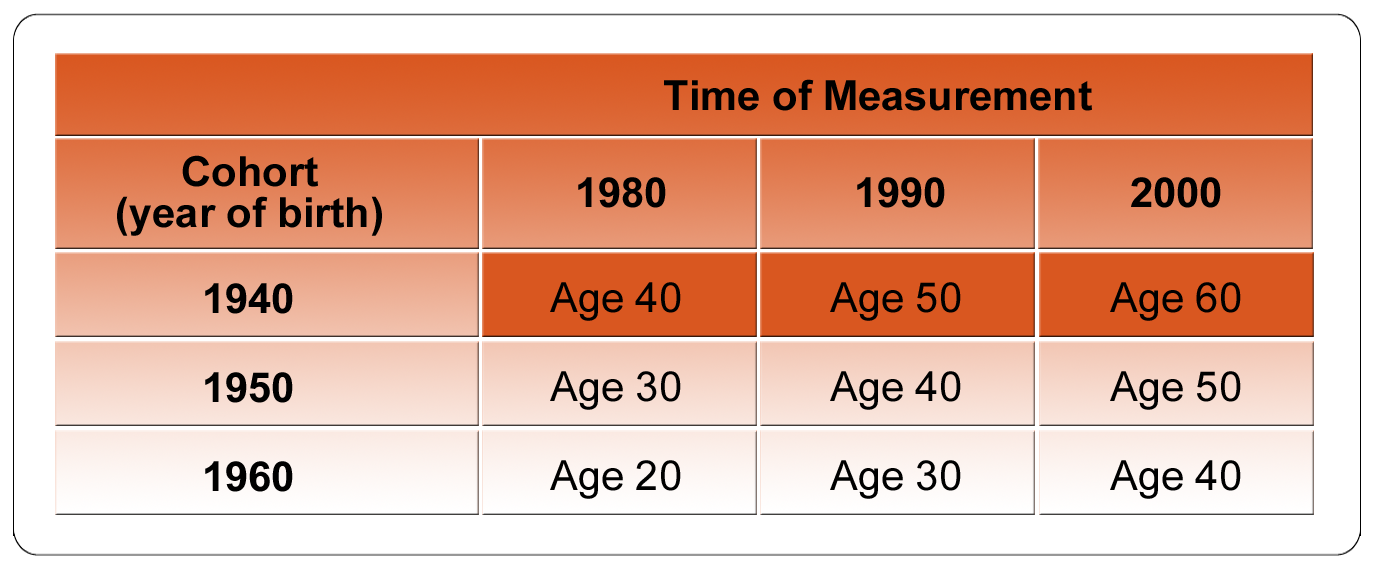
Researchers refer to a group of people born at about the same time in history as a cohort. Every cross-sectional study tests several different cohorts at the same time. A sample cross-sectional design is shown in this table with the values in each cell representing people’s age at the time of the testing.
Using this approach, can we conclude that a difference between younger adults (the 40-year-olds) and older adults (the 60-year-olds) is the result of aging? Maybe but maybe not. The problem is that cross-sectional studies confound age and cohort. These types of studies mix the effects of age and cohort together making it impossible to isolate what factor might be correlated or even causing a change in performance.
A Closer Look at Cross-Sectional Research (continued)
In cross-sectional studies of intelligence, the key difference among cohorts is education. Historically, younger cohorts have the benefit of growing up in a society that increasingly values education. Possibly because of shifts in the economy, younger generations are more likely to be freed up to and/or expected to pursue their education. Therefore, younger cohorts are likely to have had more and possibly better schooling, a factor that might explain the difference in performance on the intelligence tests among different age groups.
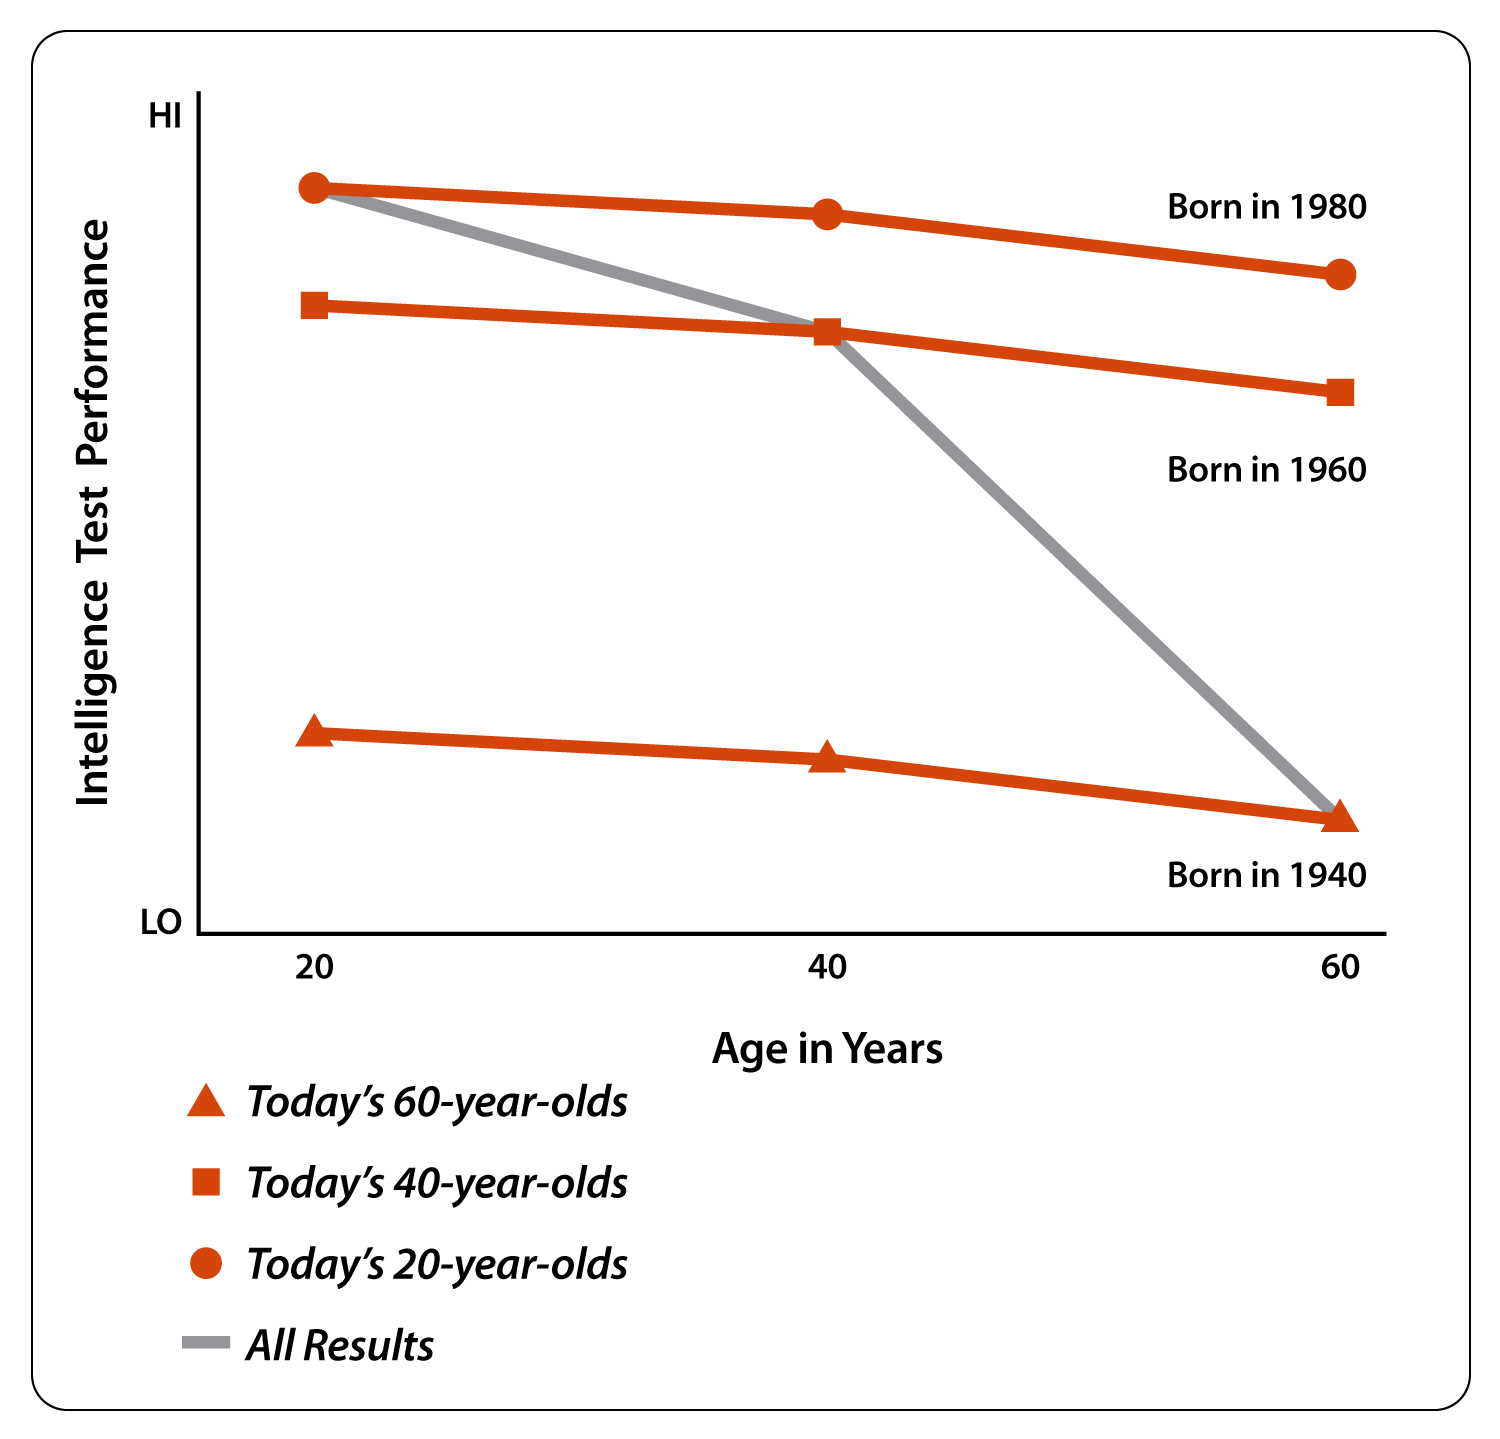
This first graph shows how a cohort difference in education could affect the results of a hypothetical cross-sectional study. At first, the difference appears to be an age difference. Click to the next screen to see what this graph looks like when we examine the performance of the cohorts over time (projecting into the past and future).
A Closer Look at Cross-Sectional Research (continued)
In the second graph, we see that it is actually a cohort difference.
A Closer Look at Longitudinal Research
In the 1960s, researchers recognized that cross-sectional studies confound age and the effects of growing up in a particular cohort making the results about cognitive aging look more pessimistic than they may have actually been. The recognition of this flaw led to a period in which longitudinal studies were believed to be the path to the truth about aging and intelligence. Unfortunately, by the mid-1970s, researchers began to recognize that longitudinal research also has its own problems.
In longitudinal studies of intelligence, performance may differ simply because when people take the same test again and again over many years, their performance tends to improve. The more often that they take the test, the more familiar participants are with the intelligence skills or abilities being tested. Therefore, older research participants are likely to perform better on the tests as they have had more practice having taken the test more often. Because longitudinal studies mix together the effects of age and frequency of testing, we cannot tell whether a specific difference in performance is due to the test-takers age or to some other differences between the testing times.
A Closer Look at Longitudinal Research (continued)
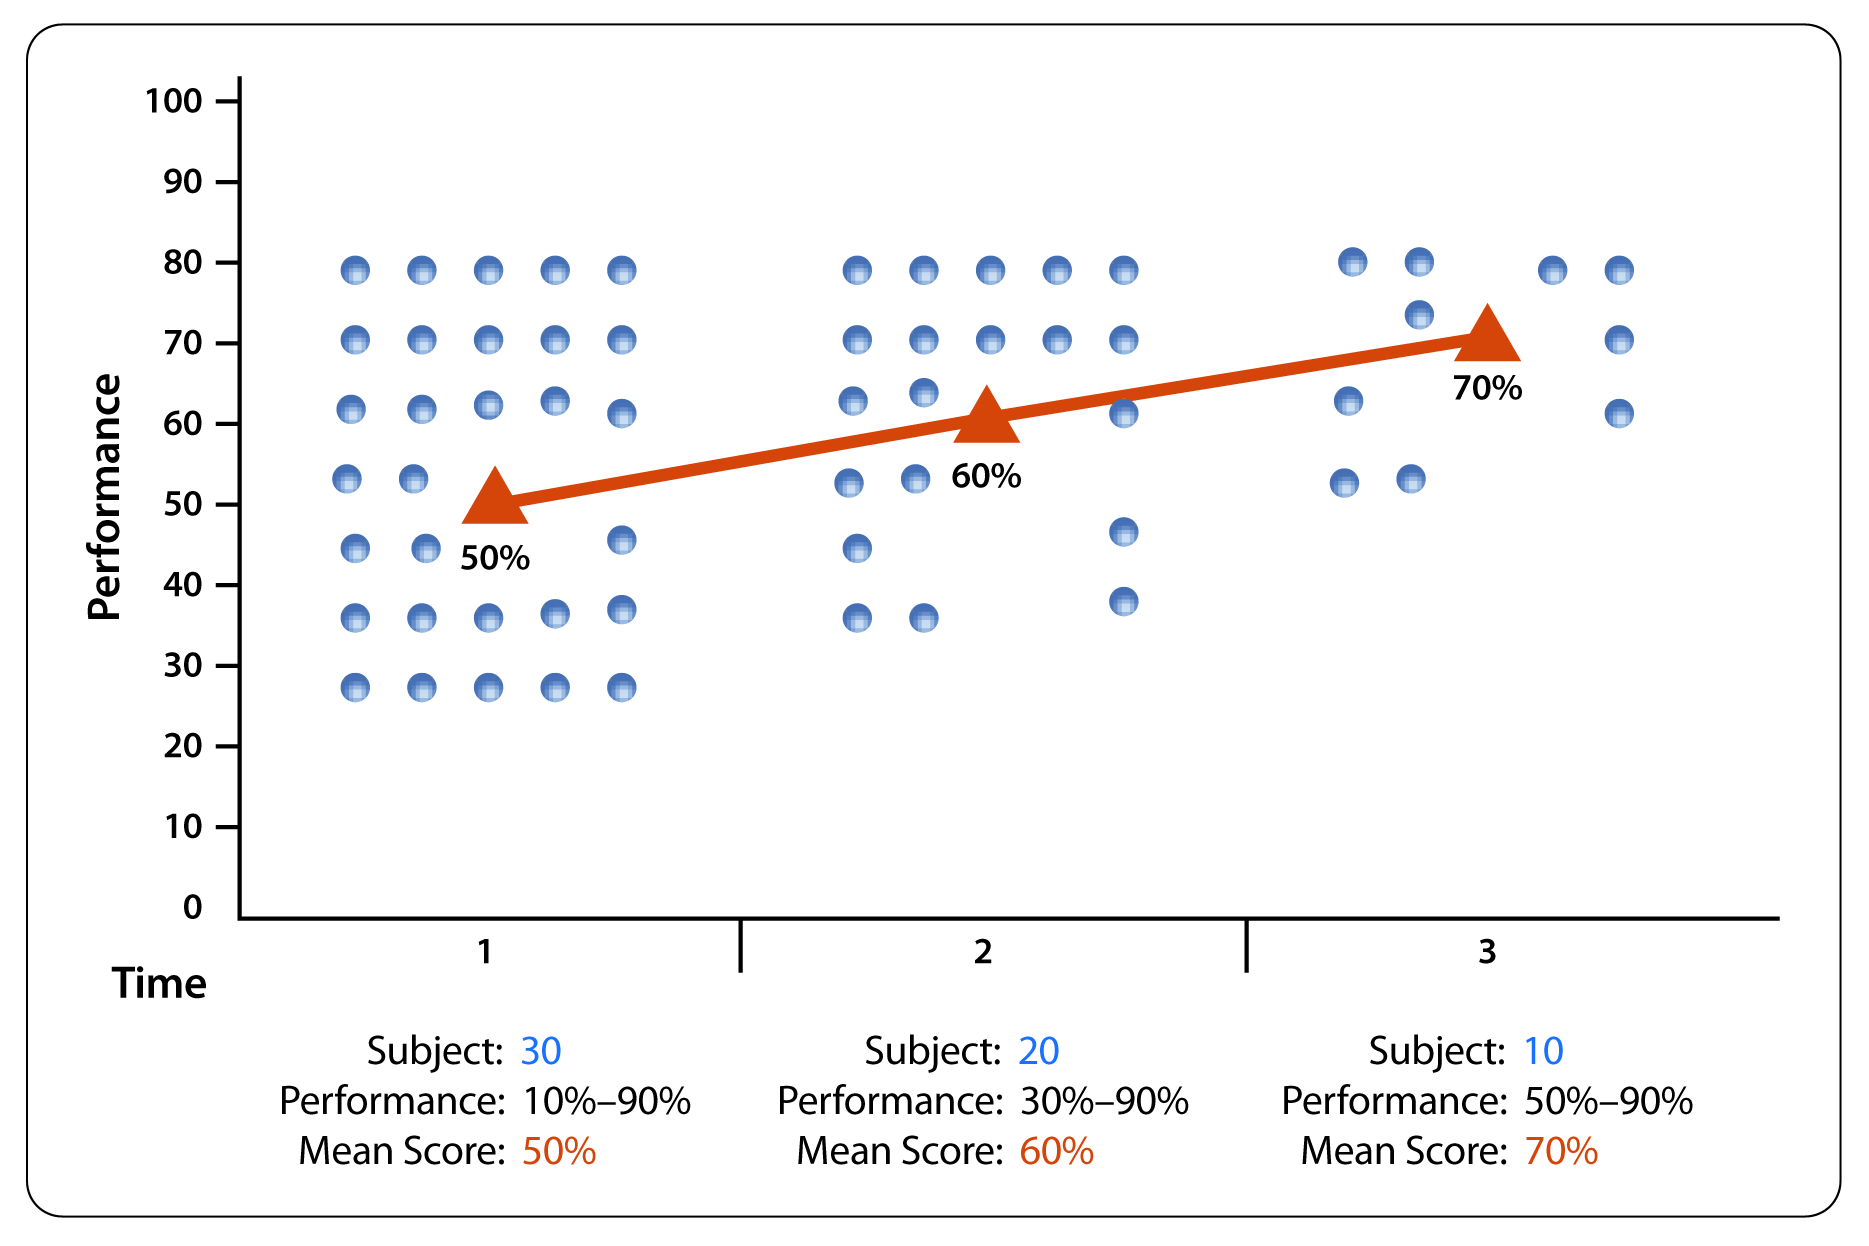
An even more serious problem is selective attrition, the tendency of some research subjects to be more likely to drop out of a study than others. Because longitudinal studies take place over a very long period of time, research participants may drop out of these studies for various reasons. In many cases, the research participants who drop out by choice, rather than, for example, for health, job, or relocation reasons, may be the subjects who initially had the lower IQ scores or did not enjoy the test-taking experience. Those who remain in the study tend to have demonstrated more success on the earlier IQ tests. The continuing and consistent participation of these higher scorers can artificially inflate the research results over time.
This graph demonstrates an extreme example of selective subject loss and note how this non-random loss can affect the mean score of the group over time.
Summary
The realization that longitudinal studies of intelligence and aging have unique problems that can make their results overly optimistic has helped researchers to achieve a more balanced view of the whole process of cognitive aging.
Combining the features of both longitudinal and cross-sectional research, some researchers employ a cohort-sequential design that begins with a longitudinal study of one cohort and then repeats the longitudinal study with the next cohort at the same age intervals as the first cohort. This method allows researchers to address the weakness of the cross-sectional study by isolating the effects of cohort. Cohort-sequential studies of IQ generally show results that are nestled between those of cross-sectional and longitudinal designs.
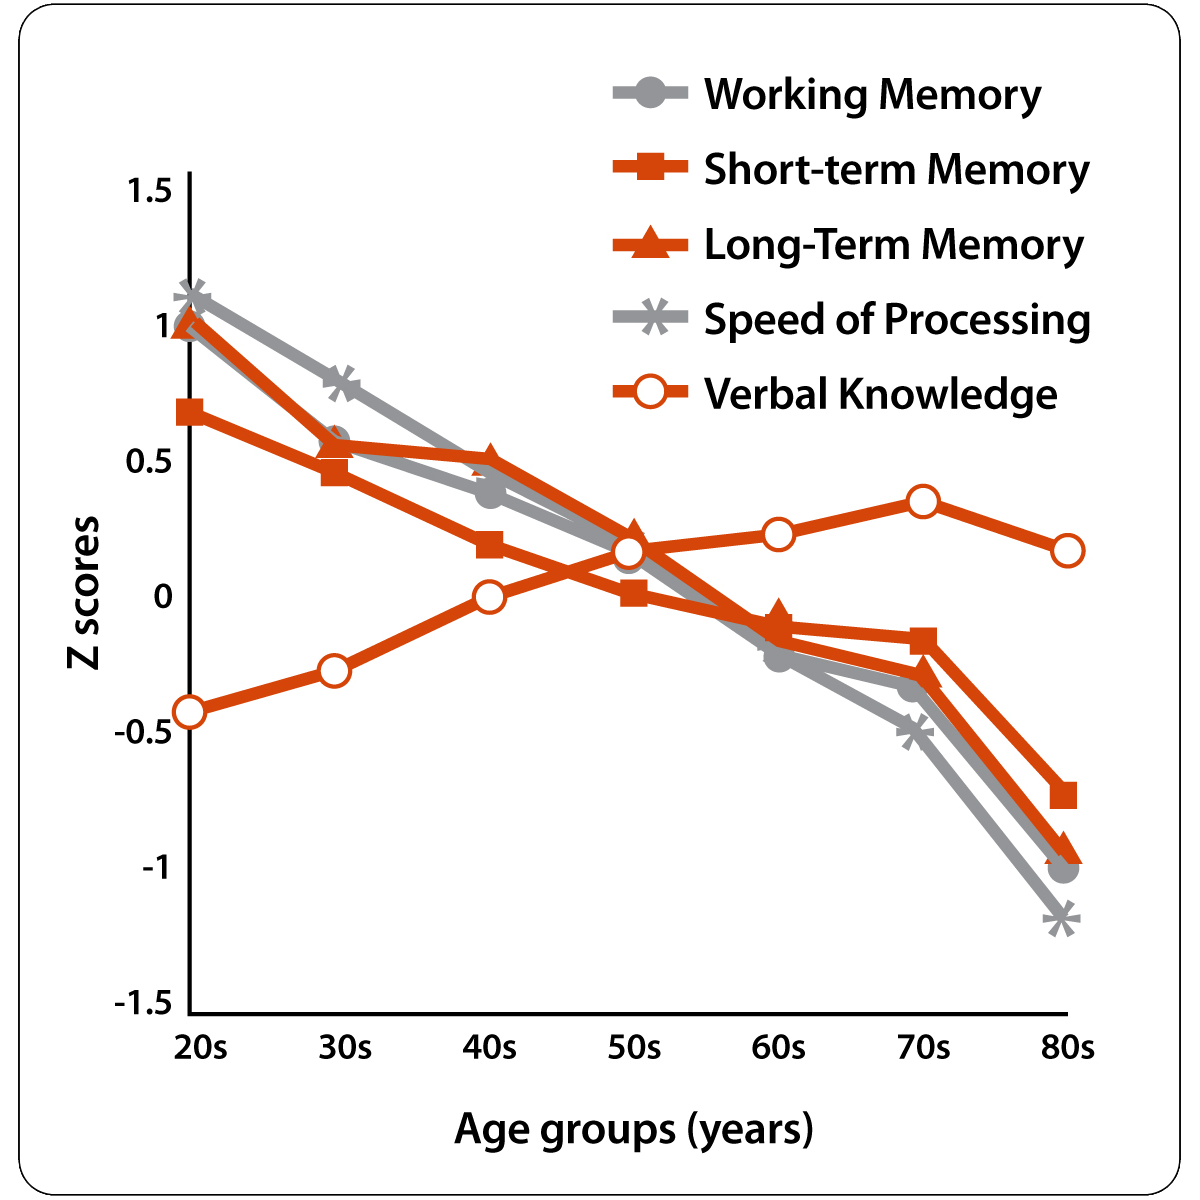
Still other researchers have studied a broad array of tests of mental performance yielding a more nuanced view of IQ across the life span. The fact that IQ has been so readily tested throughout our history gives an oversimplified impression of intelligence. In fact, IQ does represent a very complex blend of a multitude of cognitive functions. In today’s research environment, researchers must ask which cognitive facet of intelligence is being studied. For example, speed of processing and working memory capacity generally do diminish to some degree with age whereas vocabulary and world knowledge generally remain steady or even increase over time.
Taken as a whole, the study of IQ and cognitive aging is a good example of the evolving nature of scientific research.
Source:
Park, D. C., Lautenschlager, G., Hededen, T., Davidson, N., Smith, A. D., & Smith, P. K. (2002). Models of visuospatial and verbal memory across the adult life span. Psychology and Aging, 17, 299-320.
Assessment: Check Your Understanding
1.
1. Cross-sectional studies of adult intelligence:
Assessment: Check Your Understanding
2.
2. Which of the following best describes the main problem with cross-sectional studies?
Assessment: Check Your Understanding
3.
3. Longitudinal studies confound age effects with time-of-testing effects.
Assessment: Check Your Understanding
4.
4. In what sense can the history of adult intelligence testing be considered an evolution of scientific research? Write your answer in the space below.
Congratulations! You have completed this activity.Total Score: x out of x points (x%) You have received a provisional score for your essay answers, which have been submitted to your instructor.