Chapter 1. Mirror Experiment Activity 27.4
Mirror Experiment Activity 27.4
The experiment described below explored the same concepts as the one described in Figure 27.4 in the textbook. Read the description of the experiment and answer the questions below the description to practice interpreting data and understanding experimental design.
Mirror Experiment activities practice skills described in the brief Experiment and Data Analysis Primers, which can be found by clicking on the “Resources” button on the upper right of your LaunchPad homepage. Certain questions in this activity draw on concepts described in the Experimental Design primer. Click on the “Key Terms” buttons to see definitions of terms used in the question, and click on the “Primer Section” button to pull up a relevant section from the primer.
Experiment
Background
Chloroplasts are believed to have originated through endosymbiosis—that is, by an ancestral cyanobacterium being engulfed by a eukaryotic cell. Over time, the engulfed cyanobacterium lost certain cellular structures and portions of its genome and became the modern-day chloroplast that cannot survive (independently) outside of a cell. Researchers have actively debated whether the chloroplasts of all photosynthetic organisms – green and red algae, vascular plants, and even photosynthetic amoebas – are derived from a single endosymbiotic event. Do all chloroplasts share the same cyanobacterial ancestor, or did a chloroplast-forming endosymbiosis occur more than once in the evolution of photosynthetic organisms?
Hypothesis
Unlike ancient and modern-day cyanobacteria, most chloroplasts do not possess a cell wall. An exception is the chloroplasts contained within P. chromatophora, a photosynthetic amoeba (recall Fig. 27.5). The chloroplasts of these organisms possess rudimentary cell walls. This observation lead Birger Marin and colleagues to hypothesize that the chloroplasts of P. chromatophora are the result of a recent endosymbiotic event, one that occurred after the formation of chloroplasts in algae. In other words, the chloroplasts of algae and P. chromatophora do not share a common cyanobacterial ancestor.
Experiment
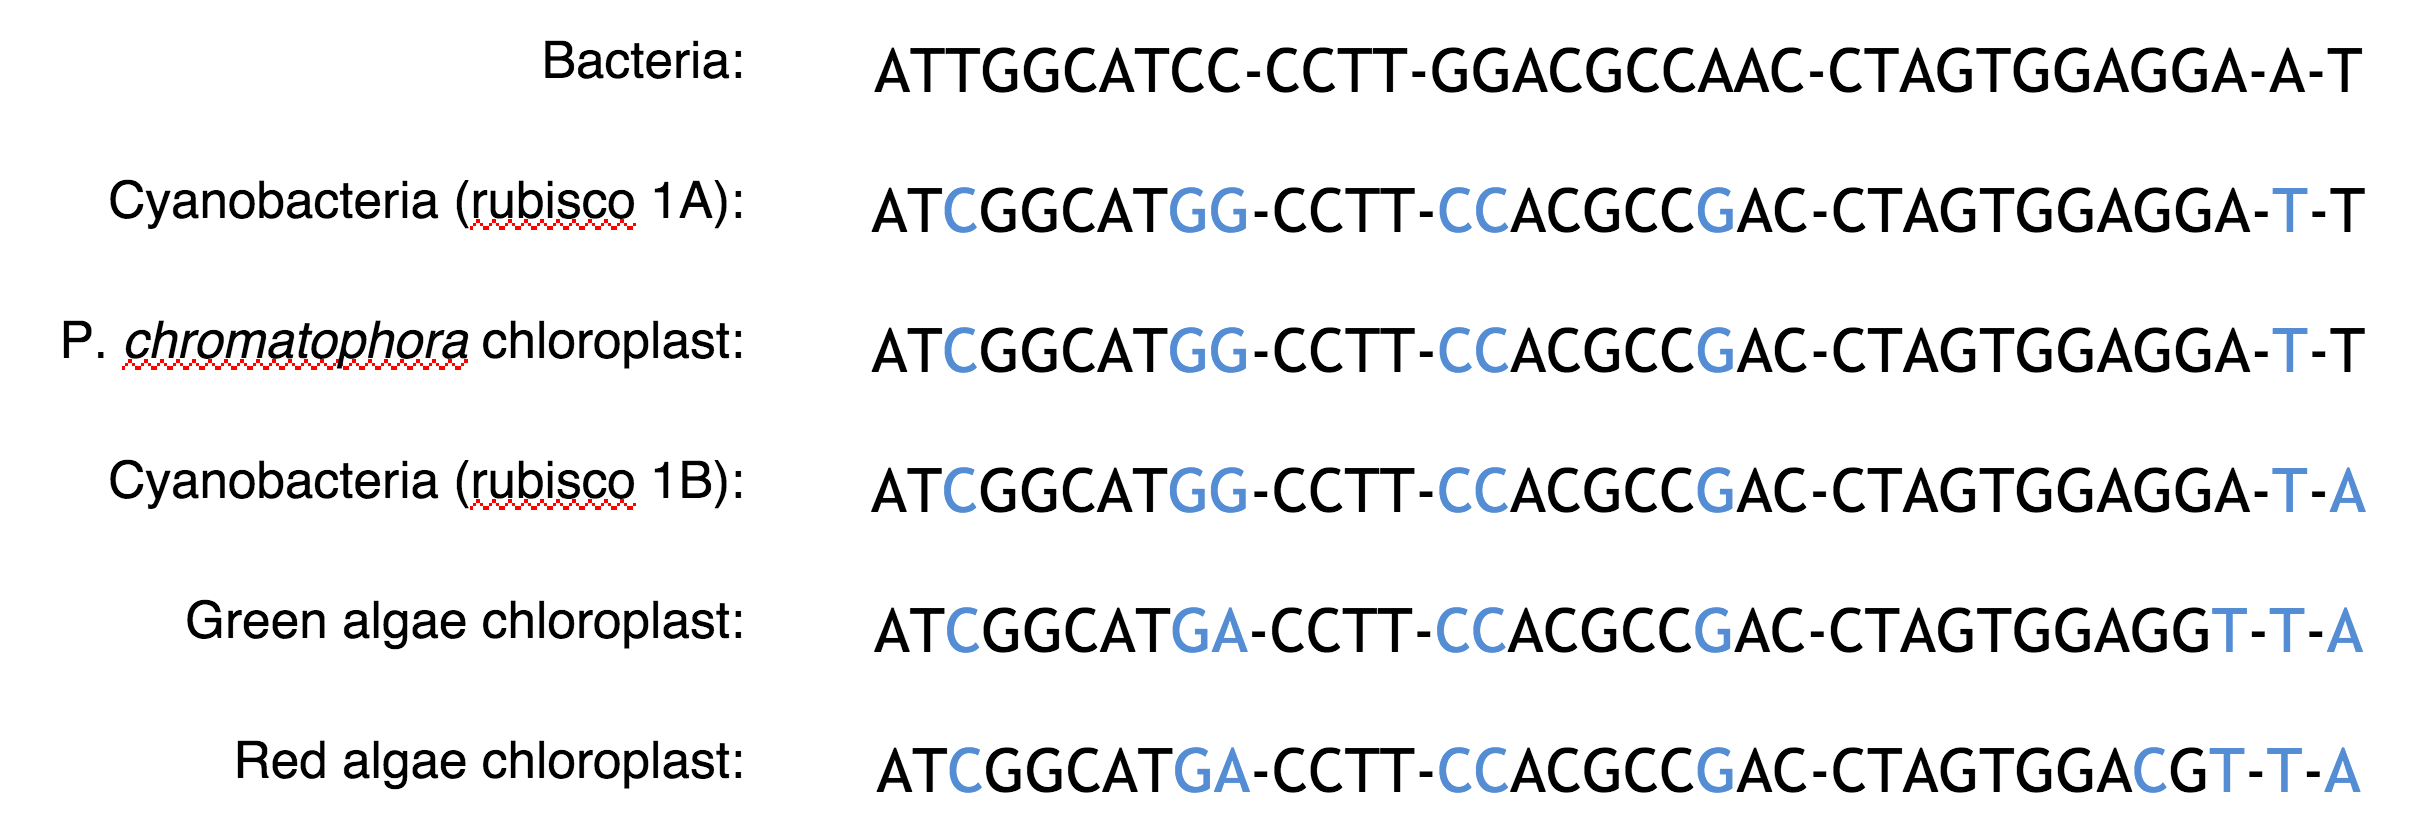
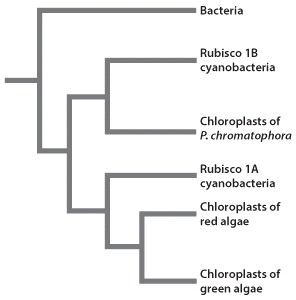
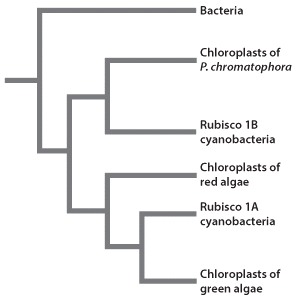
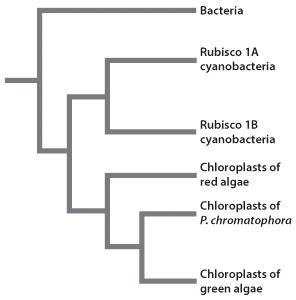
Marin and colleagues compared the DNA sequences of ribosomal genes found in chloroplasts of red and green algae, cyanobacteria, and the chloroplasts of P. chromatophora. They also compared the amino acid sequences of the RNA products of these genes. Based on this collective data, researchers derived a phylogenetic tree detailing the evolutionary relationships among bacteria, cyanobacteria, and the chloroplasts found in different organisms.
Results
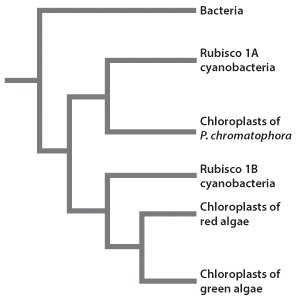
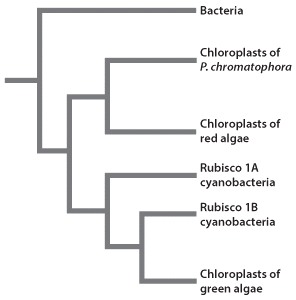
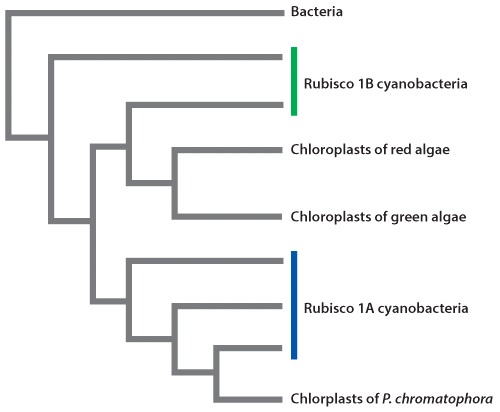
Cyanobacteria can be grouped into two categories depending on the type of rubisco enzyme they express. Some cyanobacteria produce rubisco 1A, and others synthesize rubisco 1B. Following genetic sequence analyses, it was determined that the chloroplasts of P. chromatophora are most closely related to cyanobacteria that express rubisco 1A. However, the genetic sequences of chloroplasts in red and green algae are remarkably similar to the sequence found in rubisco 1B cyanobacteria. These results provided evidence that the chloroplasts of P. chromatophora and those of red and green algae are the result of two separate endosymbiotic events (Fig. 1).
Source
Marin, B., et al. 2005. “A plastid in the making: evidence for a second primary endosymbiosis.” Protist 156: 425–32.
Question
When researchers first discovered P. chromatophora, they noticed the appearance of two large, green objects within these amoebas. Given the presence of cell walls within these structures, scientists were unsure whether these objects were “true” chloroplasts. Marin and colleagues hypothesized that these structures were chloroplasts that resulted from a recent endosymbiotic event – an event separate and distinct from the endosymbiosis that resulted in the chloroplasts present in photosynthetic algae. What could have been suitable alternative hypotheses to explain what these green structures were in P. chromatophora?
| A. |
| B. |
| C. |
| D. |
| E. |
| Alternative Hypotheses | Any hypothesis that differs from the null hypothesis (which predicts no effect). |
Experimental Design
Types of Hypotheses
A hypothesis, as we saw in Chapter 1, is a tentative answer to the question, an expectation of what the results might be. This might at first seem counterintuitive. Science, after all, is supposed to be unbiased, so why should you expect any particular result at all? The answer is that it helps to organize the experimental setup and interpretation of the data.
Let’s consider a simple example. We design a new medicine and hypothesize that it can be used to treat headaches. This hypothesis is not just a hunch—it is based on previous observations or experiments. For example, we might observe that the chemical structure of the medicine is similar to other drugs that we already know are used to treat headaches. If we went into the experiment with no expectation at all, it would be unclear what to measure.
A hypothesis is considered tentative because we don’t know what the answer is. The answer has to wait until we conduct the experiment and look at the data. When an experiment predicts a specific effect, as in the case of the new medicine, it is typical to also state a null hypothesis, which predicts no effect. Hypotheses are never proven, but it is possible based on statistical analysis to reject a hypothesis. When a null hypothesis is rejected, the hypothesis gains support.
Sometimes, we formulate several alternative hypotheses to answer a single question. This may be the case when researchers consider different explanations of their data. Let’s say for example that we discover a protein that represses the expression of a gene. Our question might be: How does the protein repress the expression of the gene? In this case, we might come up with several models—the protein might block transcription, it might block translation, or it might interfere with the function of the protein product of the gene. Each of these models is an alternative hypothesis, one or more of which might be correct.
