Chapter 113. Scanning the Brain
Learning Objectives

Describe the major methods of studying the structure and functioning of the brain.
Contrast the purpose of each tool for studying the brain.
Review
Review
Select the NEXT button to continue with the Review.
1. The human brain is hidden within the skull, but its shape and activity can be observed and measured with the modern tools of neuroscience. Bombarding the brain with x-rays and magnetic pulses can reveal the structure of each brain region and can detect abnormalities, including tumors and damage from strokes. The faint electrical and magnetic signals generated by individual neurons, as well as changes in blood flow to brain areas, can be captured and analyzed to paint a picture of the moment-by-moment pattern of brain activity.
Review
Review
Select the NEXT button to continue with the Review.
2. The oldest of these tools is the electroencephalogram (EEG)—an amplified recording of the electrical signals generated by the synchronized activity of thousands of neurons in each region of the brain. These “brain waves” are measured by electrodes placed on the scalp. EEG is used extensively in research on sleep, as it can track the changes in overall brain activity as the sleeper moves through the stages of sleep. EEG can also identify the location of seizures in a patient with epilepsy.
Review
Review
Select the NEXT button to continue with the Review.
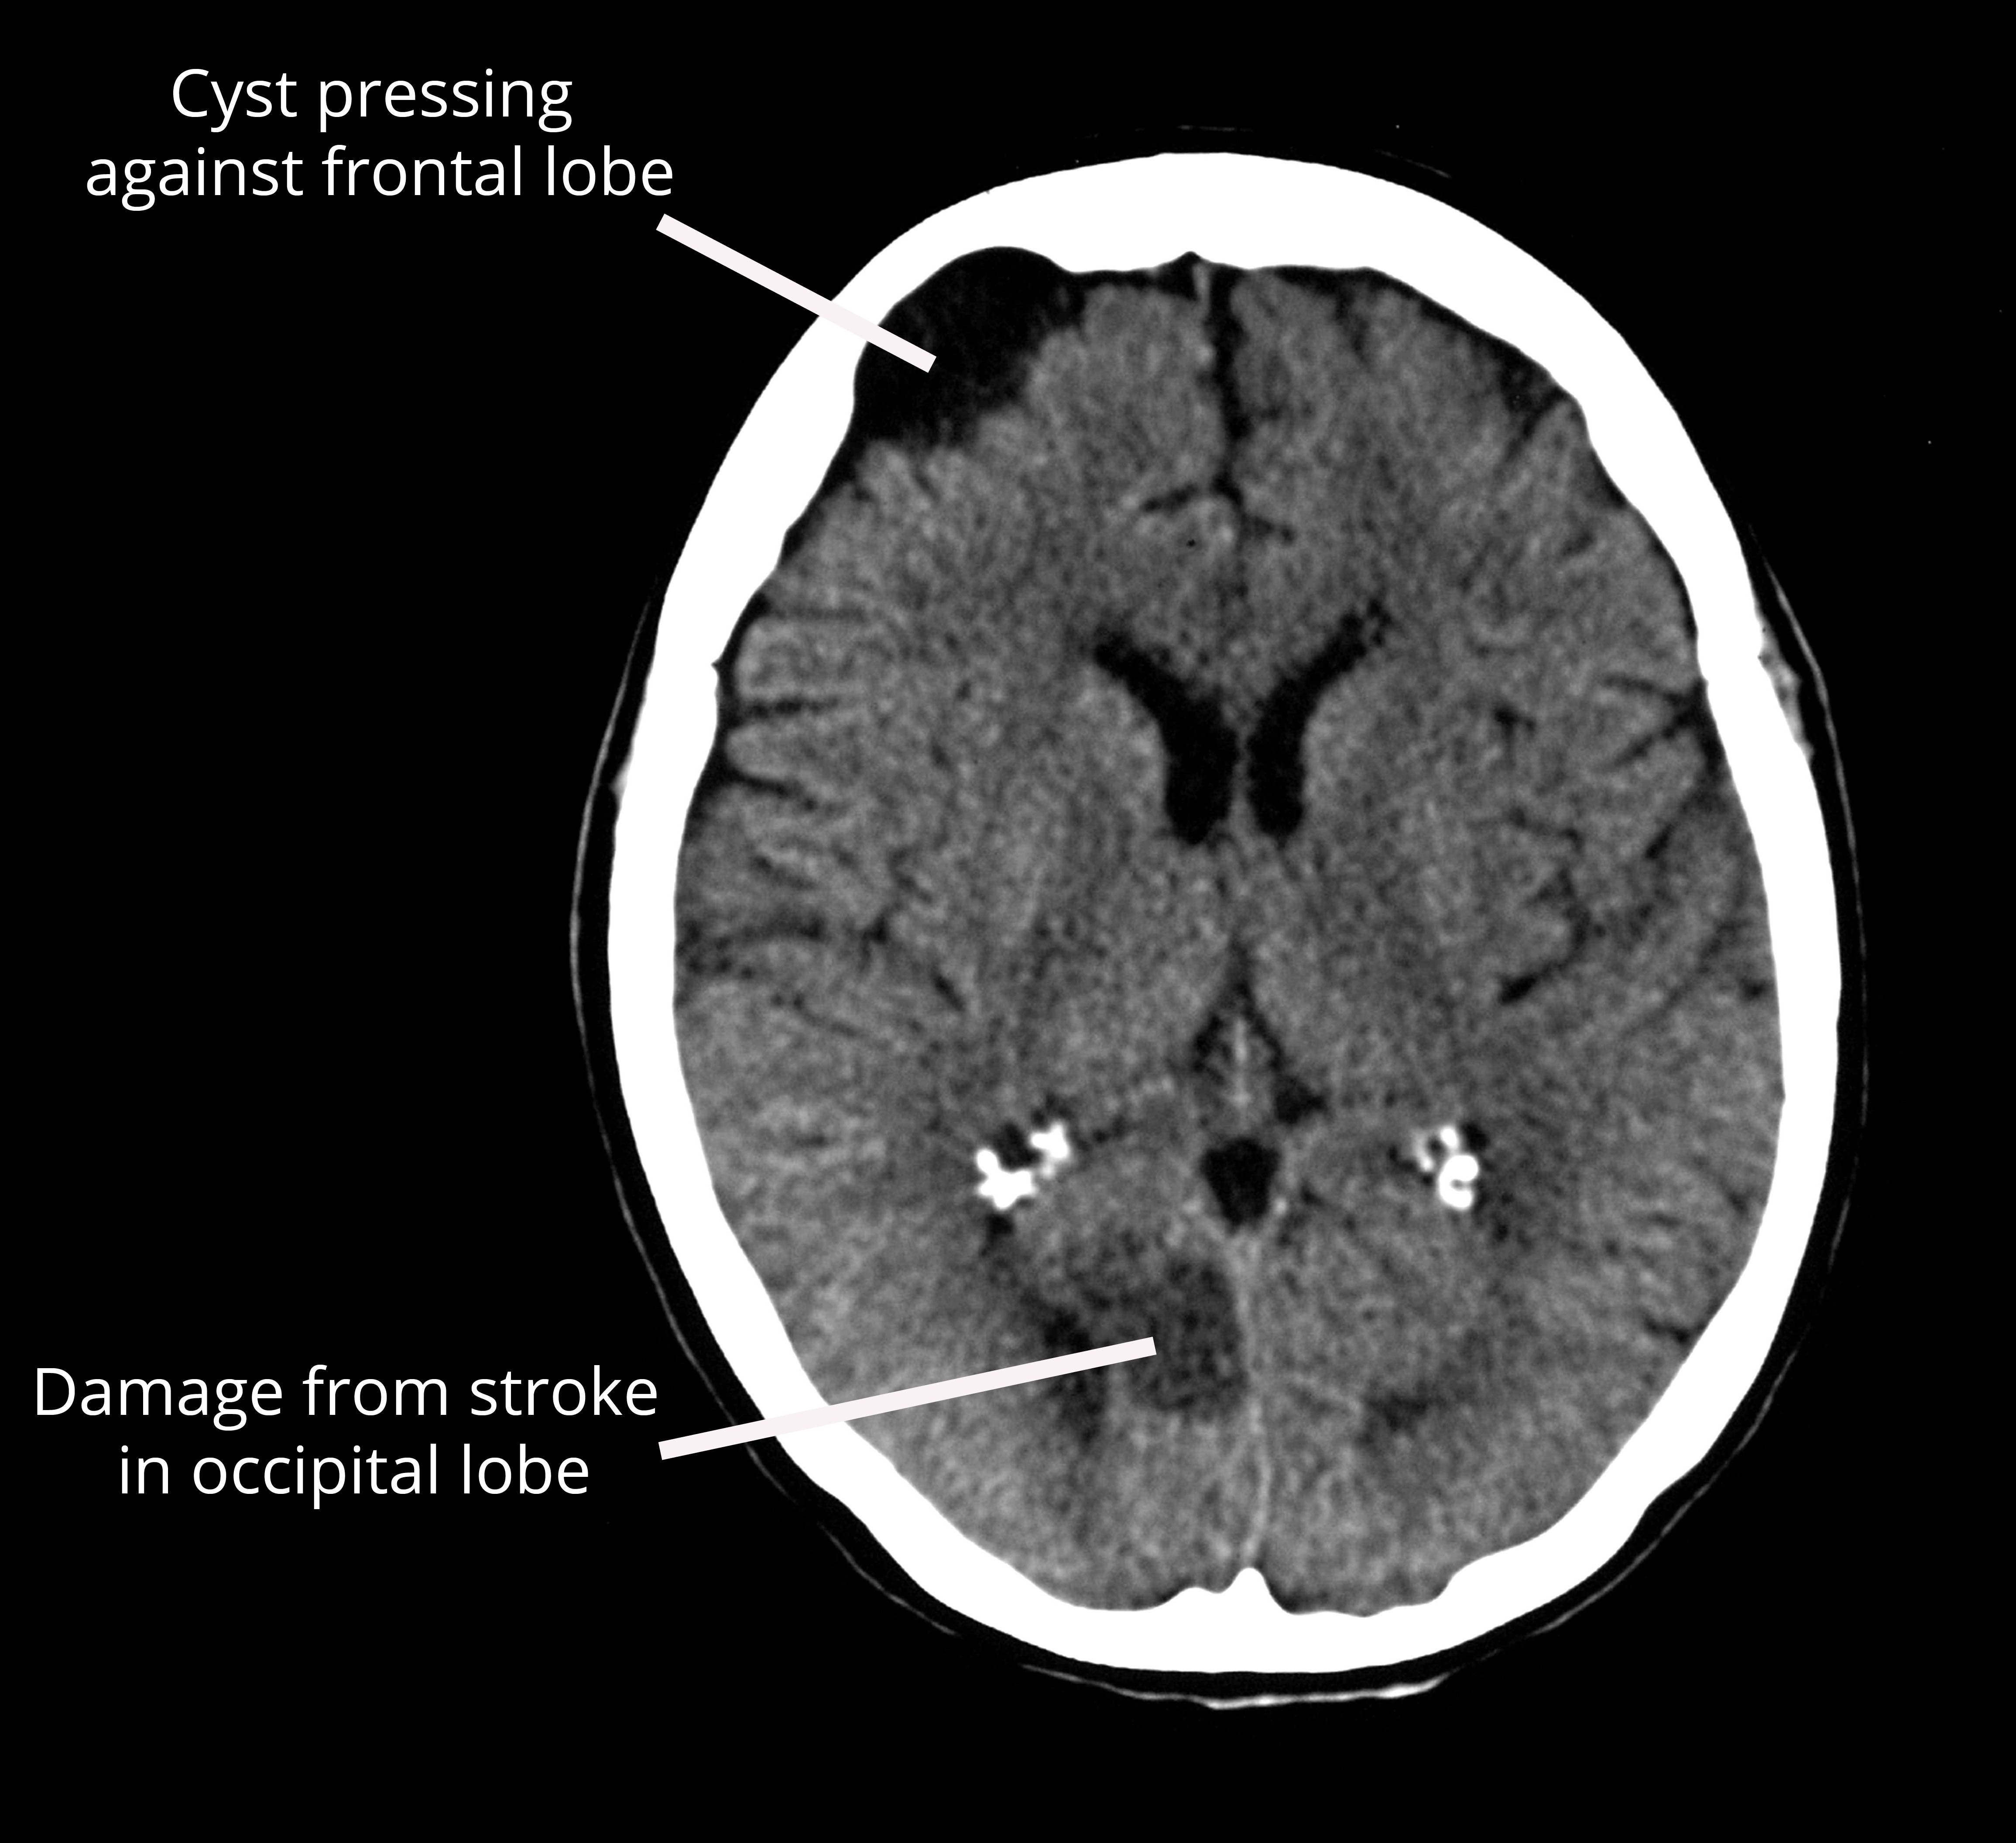
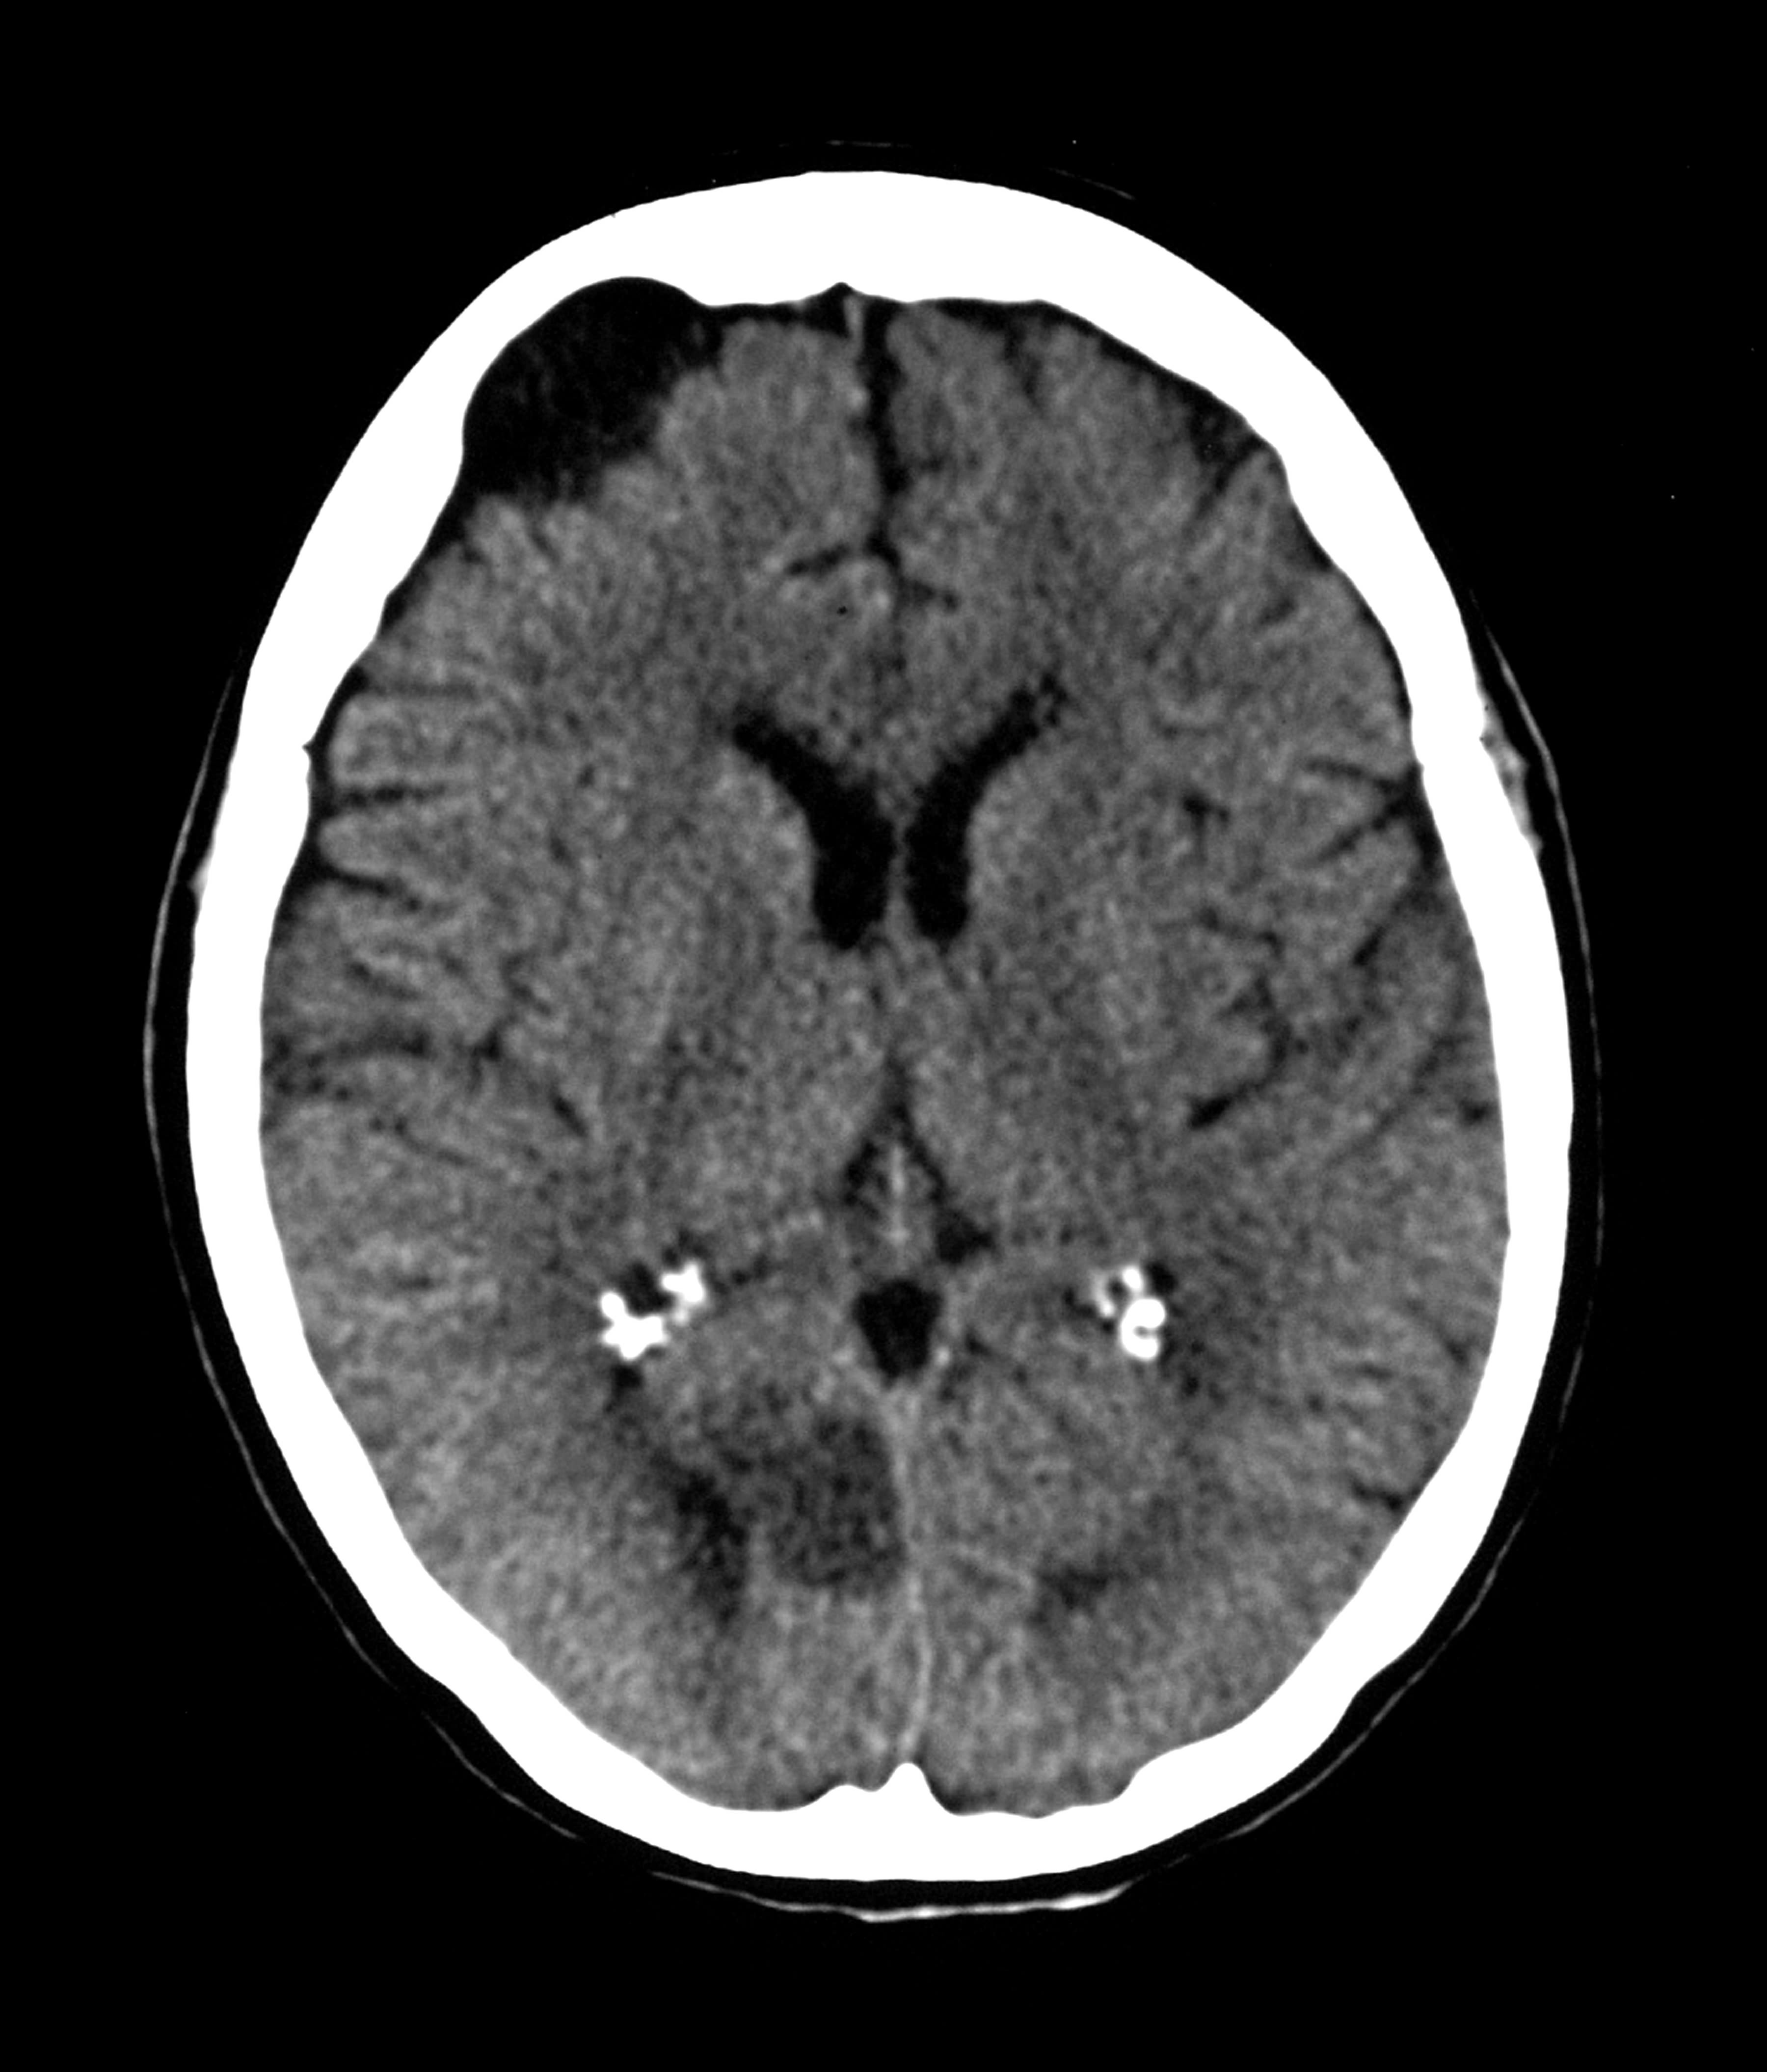
3. Next came a type of brain scan called CT (computed tomography). This is a series of x-ray photographs taken from different angles in the same plane and combined by computer to create a single image that shows a “slice” through the brain. CT scans provide a crude view of the structure of the brain, and are used mainly to identify abnormalities in brain tissue caused by cancer, stroke, or fluid-filled cysts.
Review
Review
Select the NEXT button to continue with the Review.
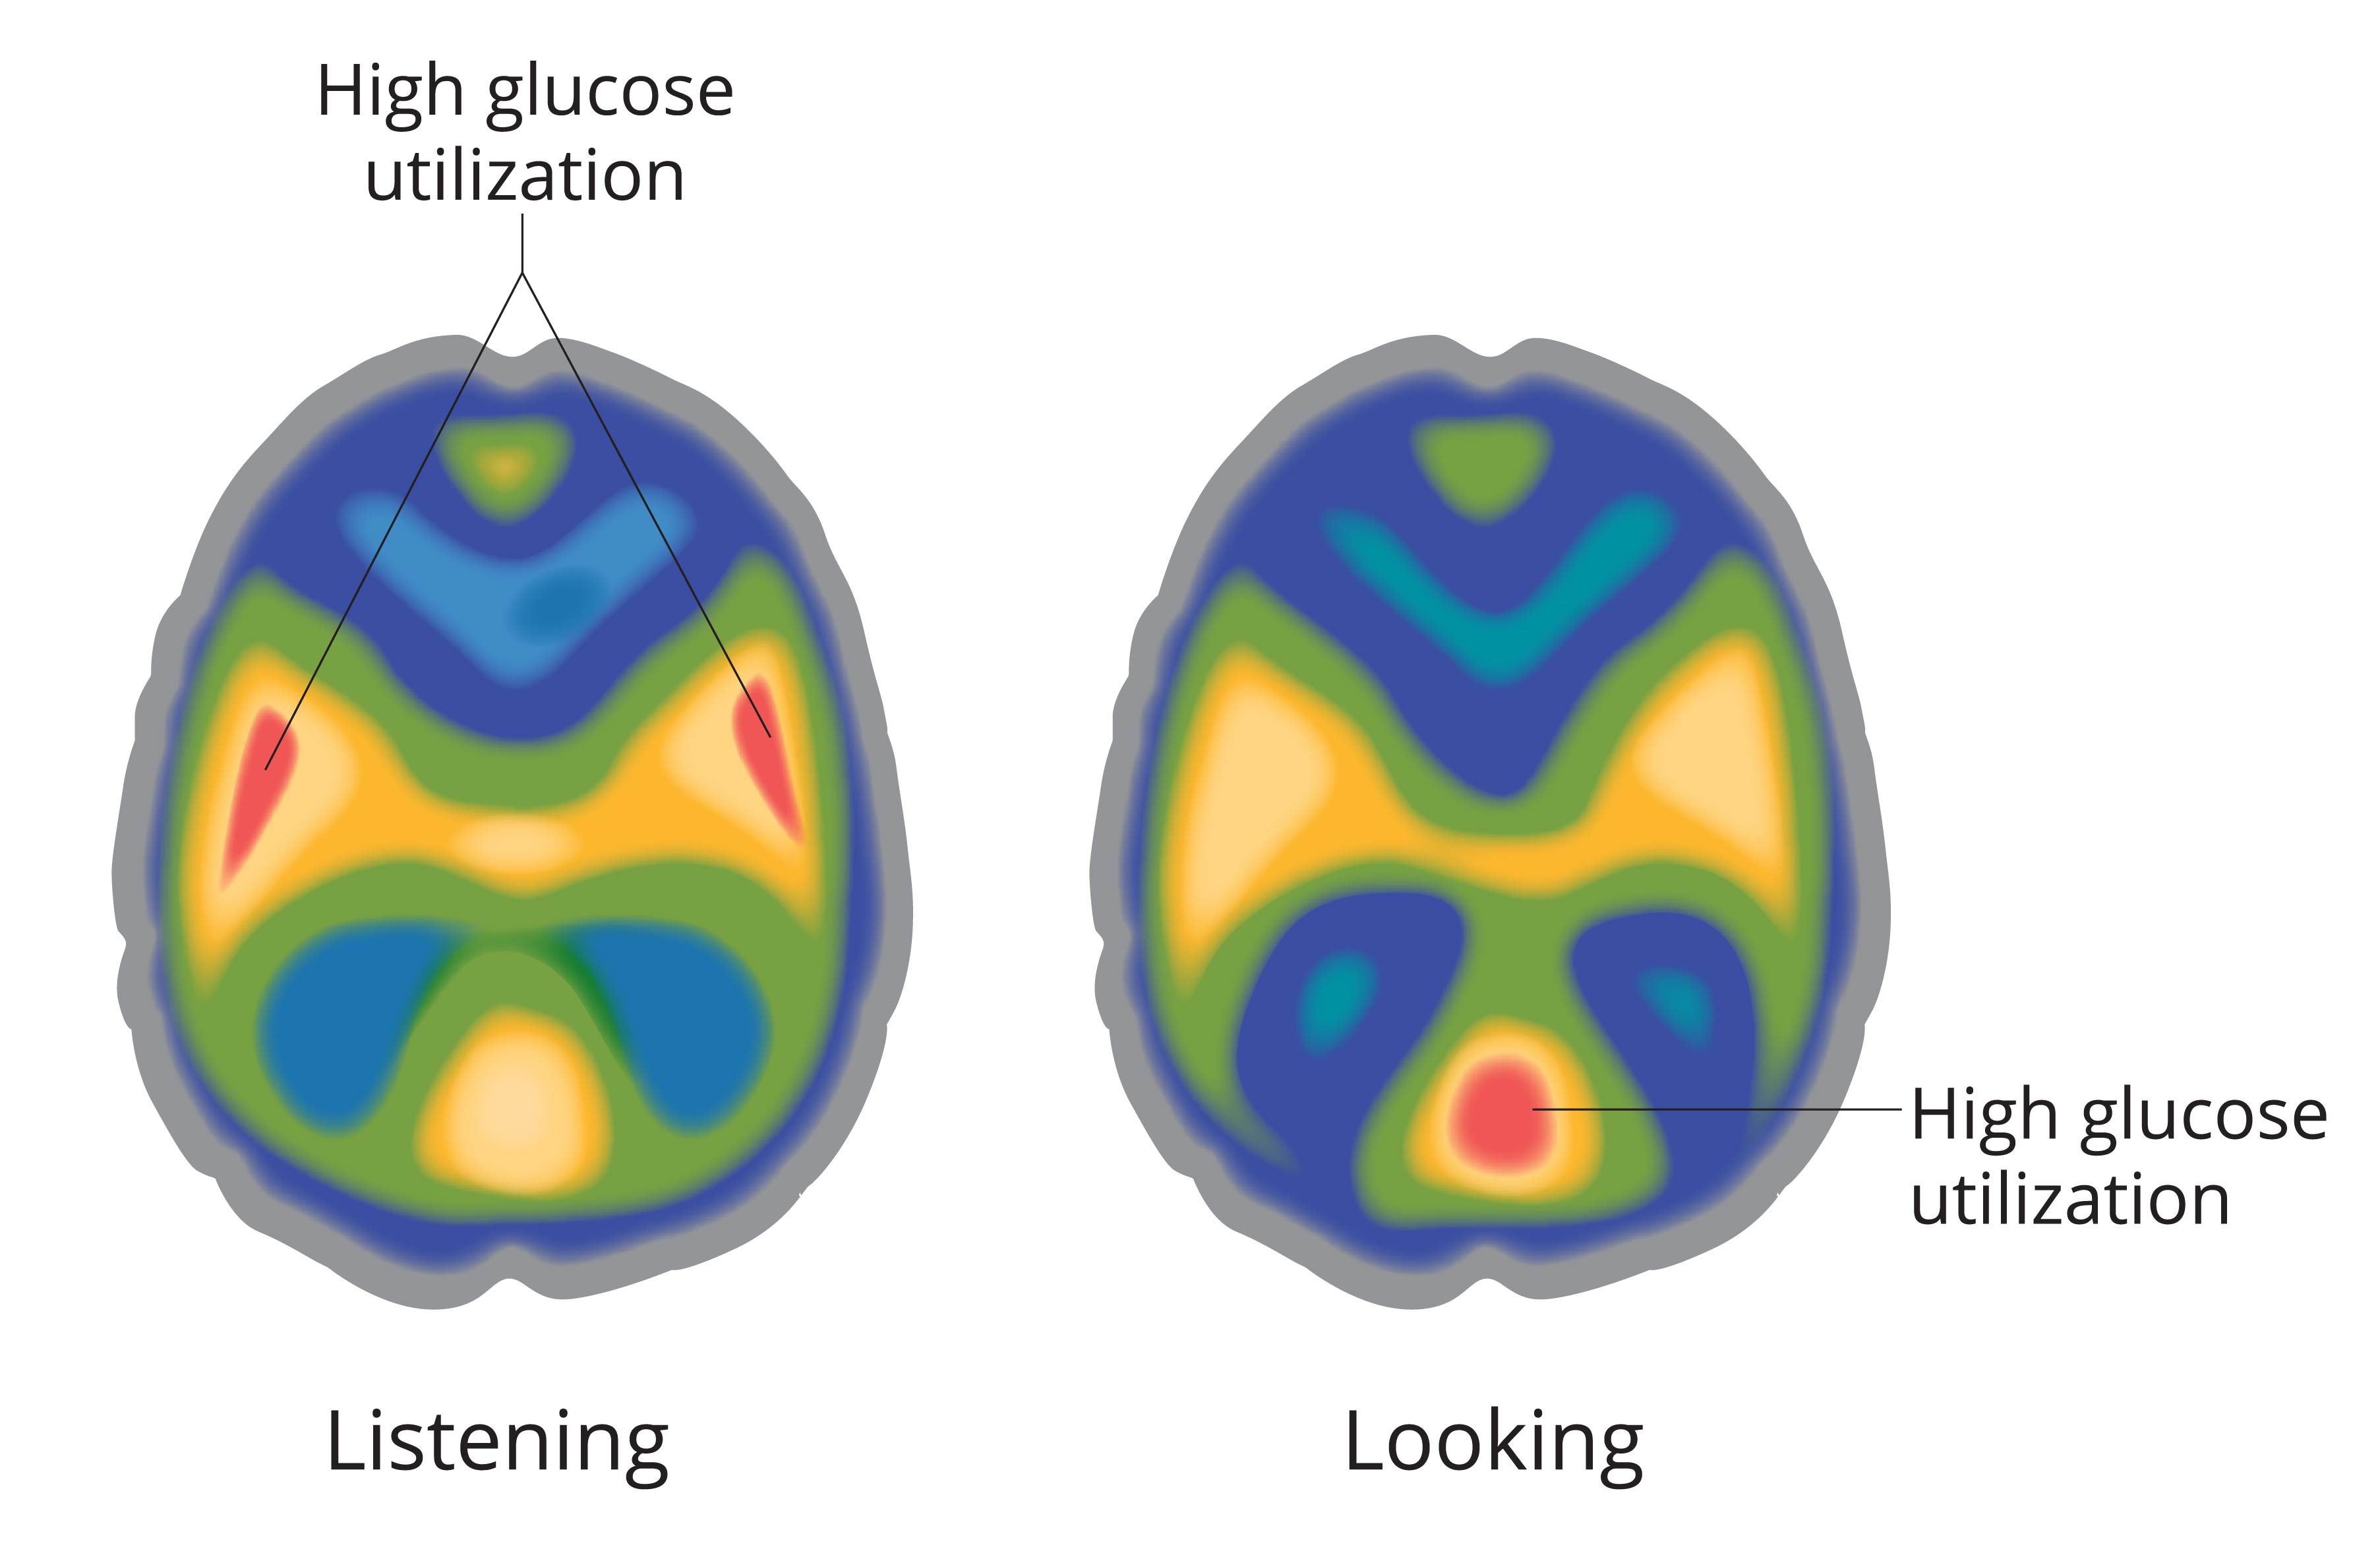
4. The brain requires glucose as fuel. Researchers developed a way of injecting a radioactive form of glucose into the bloodstream, and then using PET (positron emission tomography) to detect where that glucose flows while the brain performs a cognitive task. A PET scan provides a visual display of brain activity that shows areas of high glucose use in yellow and red, while areas of low glucose use are shown in green and blue. These PET scan images demonstrate that “looking” activates the visual areas at the rear of the brain, while “listening” activates the auditory areas on the sides of the brain.
Review
Review
Select the NEXT button to continue with the Review.
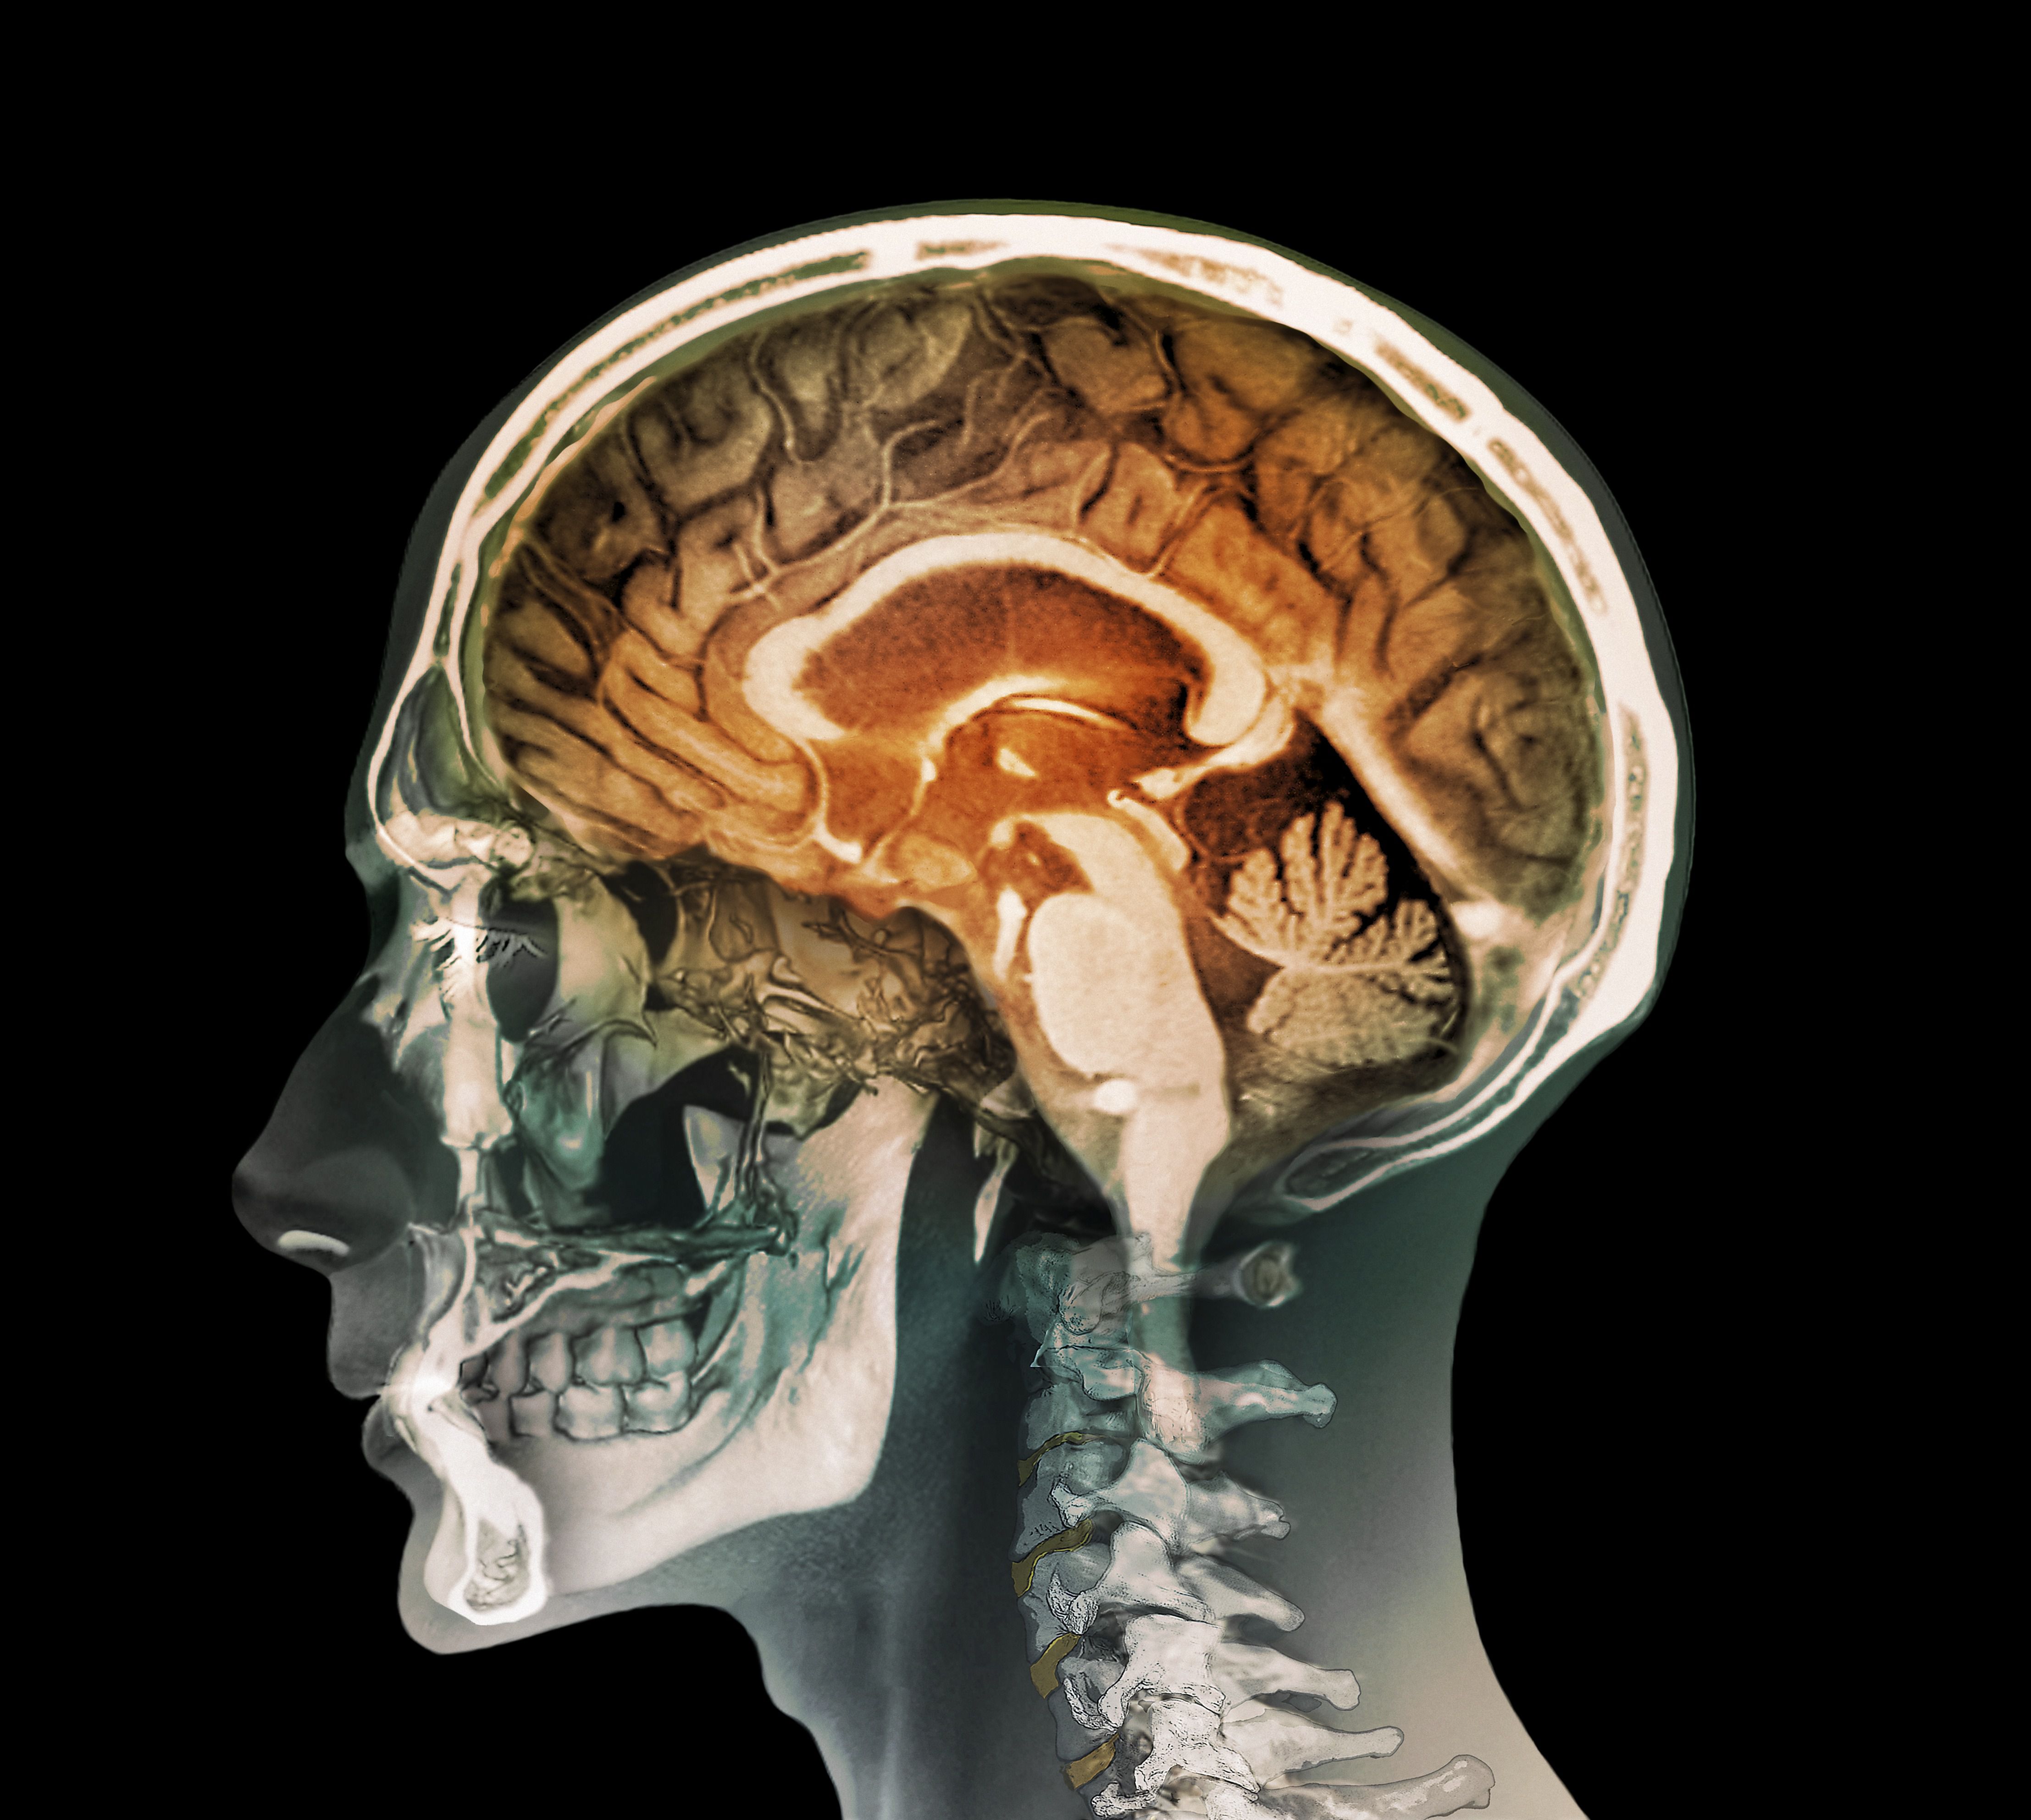
5. MRI (magnetic resonance imaging) provides the clearest, most detailed view of the individual structures within the brain. This technique uses radio waves to disrupt magnetically aligned atoms in the brain. As the atoms snap back into position, the scanner detects the movement and produces a computer-generated image at such high resolution that it looks like a textbook illustration. On this MRI image, can you recognize and name some of the important structures within the brain?
Review
Review
Select the NEXT button to continue with the Review.

6. A single MRI scan shows the structure of the brain, but also can detect the blood concentration of oxygen, another type of fuel that neurons require. By performing multiple MRI scans in quick succession, fMRI (functional magnetic resonance imaging) tracks changes in blood flow during different cognitive tasks. This scan shows that, when a person is engaged in a conversation, a high level of oxygen flows to the language areas of the brain.
Review
Review
Select the NEXT button to continue with the Review.
7. The newest method of brain scanning is called MEG (magnetoencephalography). It detects the activity of clusters of neurons in specific regions of the brain. Rather than measuring the neurons’ electrical signals directly, MEG uses multiple detectors around the head to measure the magnetic fields generated by that electrical activity. Like EEG, MEG can track moment-by-moment changes in brain activity, but does a better job than EEG in identifying the exact location of the activity.
Practice 1: Exploring Brain Scans
Practice 1: Exploring Brain Scans
Roll over each of the types of brain scans to view a brief description.
CT SCAN
EEG
fMRI SCAN
MEG SCAN
MRI SCAN
PET SCAN
CT (computed tomography) scan: low-resolution scan of brain structure, produced by combining multiple x-rays from different directions; most useful for detecting brain tumors and strokes
EEG (electroencephalogram): measures the electrical activity of the brain, as recorded from electrodes on the scalp; most useful for tracking moment-to-moment changes in the activity of different areas of the brain
fMRI (functional magnetic resonance imaging): high-resolution scan of brain activity produced by tracking the flow of oxygen; most useful for identifying the specific brain regions that are most active during different cognitive tasks
MEG (magnetoencephalography): high-resolution scan of brain activity produced by measuring magnetic fields generated by electrical activity of the brain; useful for tracking moment-to-moment activity changes in small areas of the brain
MRI (magnetic resonance imaging): high-resolution scan of brain structure produced by using radio waves to disrupt magnetically aligned atoms in the brain; most useful for detecting small abnormalities in brain tissue
PET (positron emission tomography): low-resolution scan of brain activity produced by tracking the flow of glucose; most useful for comparing the broad pattern of brain activity during different cognitive tasks
Practice 2: Recognizing Brain Scans
Practice 2: Recognizing Brain Scans
Roll over each of the images to view the name of the brain scan along with a brief description.


EEG (electroencephalogram): measures the electrical activity of the brain; typically shown as individual waves from each electrode
MRI (magnetic resonance imaging): high-resolution scan of brain structure; measures repositioning of magnetically aligned atoms; typically shown as monochrome side view or sagittal slice
CT (computed tomography) scan: low-resolution scan of brain structure; typically monochrome scan shown as horizontal slice of brain
fMRI (functional magnetic resonance imaging): high-resolution scan of brain activity; measures flow of oxygen; typically shown as small splotches of color superimposed on an MRI scan
PET (positron emission tomography): low-resolution scan of brain activity; measures flow of glucose; typically a horizontal slice with large splotches of bright colors
MEG (magnetoencephalography): high-resolution scan of brain activity; measures magnetic fields generated by electrical activity of the brain; typically shown as color splotches superimposed on a head
Quiz 1
Quiz 1
Match the terms to their descriptions by dragging each colored circle to the appropriate gray circle. When all the circles have been placed, select the CHECK ANSWER button.
Quiz 2
Quiz 2
Classify the types of brain scans by dragging each label to a gray area in the appropriate section of the chart. When all the labels have been placed, select the CHECK ANSWER button.
| Structure | Activity | |
| Rough | ||
| Detailed |
Conclusion