Chapter 76. Obedience: The Milgram Experiment
Learning Objectives
Describe the results of Stanley Milgram’s experiment on obedience.
Understand how the social environment influences obedience.
Review
Review
Select the NEXT button to continue with the Review.
1. Would you give a classmate a painful electric shock just because your professor ordered you to do it? How far would you go to obey the commands of an authority figure? Those were the questions investigated in a classic experiment by Stanley Milgram during the 1960s.
Review
Review
Select the NEXT button to continue with the Review.

2. Milgram recruited male research participants for a study to assess the effects of punishment on learning. By what appeared to be a random drawing, each participant was assigned the role of teacher.
Review
Review
Select the NEXT button to continue with the Review.
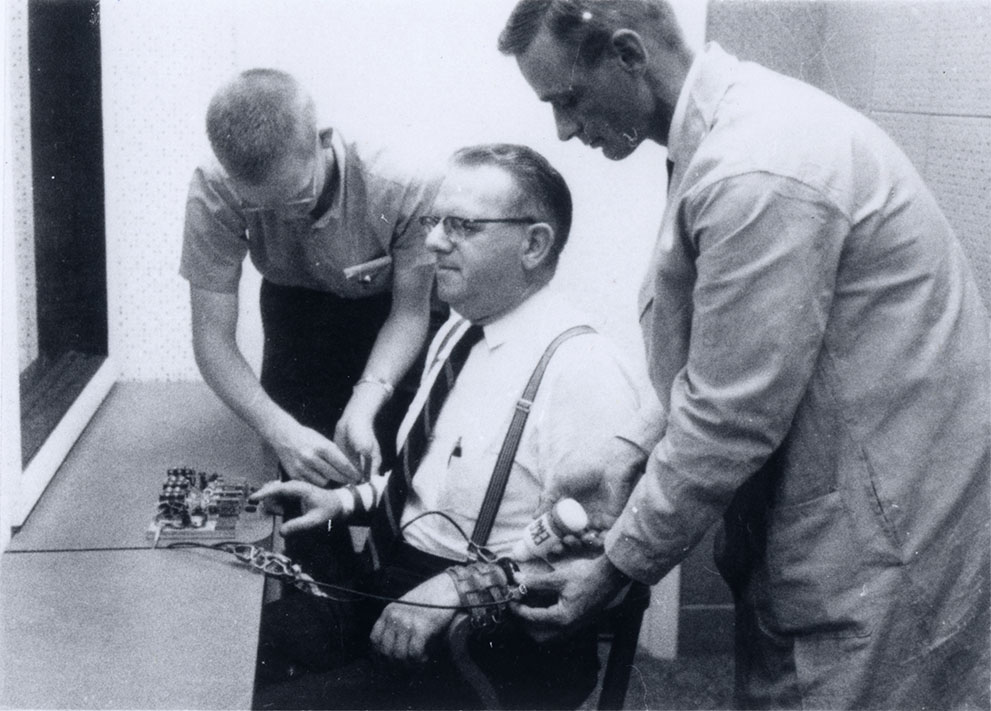
3. The "teacher" was ordered to deliver electric shocks to the "learner," in an adjacent room, for any errors made while the learner attempted to memorize a list of word pairs. (The "learner" was the experimenter's confederate—paid by the experimenter to act in a certain way—and was not actually shocked, but the "teacher" didn't know this.)
Review
Review
Select the NEXT button to continue with the Review.
4. The “teacher” was instructed to begin with a switch labeled “15 Volts—Slight Shock” for the first error made by the “learner.” For each subsequent error, the teacher was instructed to increase the shock level in 15-volt intervals toward the final “450 Volts—XXX” switch.
Review
Review
Select the NEXT button to continue with the Review.
5. In spite of the "learner’s" escalating protests and screams of pain, 63 percent of the "teachers" complied fully with the experimenter’s commands and delivered 450 volts—a potentially deadly shock.
Practice 1: Moving the Learner
Practice 1: Moving the Learner
Select the “Show the new arrangement” button to view the new physical arrangement.
|
|
In Milgram's original experiment, the
experimenter sat in the same room with the "teacher" (the real participant), while the "learner" was out of
sight in another room. Obedience rate: 63 percent. Can you predict the results? No. When the "learner" was in the same room with the "teacher," the obedience rate dropped to 40 percent. (Only 40 percent went to 450 volts.) Yes. When the "learner" was in the same room with the "teacher," the obedience rate dropped to 40 percent. (Only 40 percent went to 450 volts.) |
Practice 2: Moving the Experimenter
Practice 2: Moving the Experimenter
Select the “Show the new arrangement” button to view the new physical arrangement.
|
|
In Milgram's original experiment, the
experimenter sat in the same room with the "teacher" (the real participant), while the "learner" was out of
sight in another room. Obedience rate: 63 percent. Can you predict the results? No. When the experimenter was in a different room, the obedience rate dropped to 21 percent. (Only 21 percent went all the way to 450 volts.) Yes. When the experimenter was in a different room, the obedience rate dropped to 21 percent. (Only 21 percent went all the way to 450 volts.) |
Practice 3: Teacher Decides the Punishment
Practice 3: Teacher Decides the Punishment
Click on the slider bar to move the pointer and make your prediction. Then select the “What happened?” button.
In one final variation on his study, Milgram allowed the "teachers" to choose the level of punishment for each error the "learner" made (that is, they were not told to increase the level of shock by 15 volts for each error). Knowing what you do about the results of the original study, predict the average level of shock these new "teachers" chose to deliver.
Quiz
Quiz
Select a button to indicate whether each statement is True or False. When responses have been placed for all the statements, select the CHECK ANSWER button.
| True | False | |
|---|---|---|
Milgram found that most people disobey an authority's commands to deliver painful shocks to an innocent victim. |
||
Milgram found that, compared to the original study where the experimenter was in the same room with the "teacher," the obedience rate of the "teachers" decreased when the experimenter was out of sight in a different room. |
||
Milgram found that a “teacher's” obedience increased when the "learner" was in the same room as the "teacher. |
||
When Milgram allowed the “teachers” to decide how much shock to give the "learner," only one of the "teachers" delivered a 450-volt shock. |
Conclusion