Chapter
1. Isle Royale Wolf and Moose Population Dynamics
1.1Test New Tab
New section content
NEXT
1.2Background
When studying populations of other animals, it is often necessary to study the relationships between two different populations that interact closely with one another, such as in predator/prey relationships. While predator/prey relationships can also be studied at the community level, they are important in population ecology because these relationships often cause a cycling of population sizes between high and low populations.
While we discussed exponential growth in the human population, continuous exponential growth rarely occurs in nature. Most populations exhibit a logistical growth pattern, which starts out slowly, enters an exponential growth phase, and then slows again as limiting factors take effect. If an environment had unlimited resources and no natural disasters, a population could grow at its biotic potential. This is its maximum reproductive rate provided by its fertility rate and survival rate. However, this potential is not realized in the presence of limiting factors.
There are two basic types of limiting factors. Density-independent limiting factors reduce the population size regardless of its density such as tornadoes, hurricanes, fires, tsunamis, volcanoes, and weather. Density-dependent limiting factors, such as food supply, available space, water, nutrients, and disease affect the population size the most when the density is high. Predation is also considered a density-dependent limiting factor because the density of the predators affects the density of the prey, and vice versa.
Studying Predator-Prey Relationships on Isle Royale
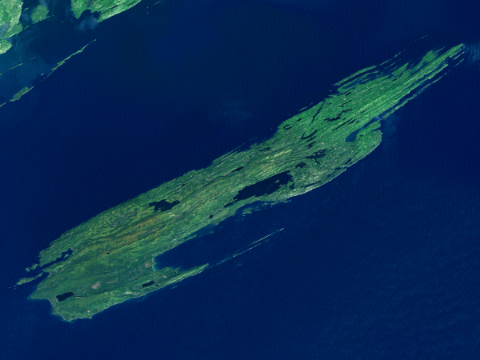
Isle Royale is a small island located in Lake Superior in waters belonging to the state of Michigan. The island is located 15 miles from shore and is approximately 40 miles long and 5 miles wide, and it covers about 200 square miles. As a national park, the island is protected, and camping and scientific research are limited by a system of permits. Subsequently, the animals and plants of the island are left to interact in a relatively undisturbed environment.
The island is a superb study site for predator – prey relationships because of its relatively undisturbed nature, location and size. Because the island is far from shore, animal migration has little to no effect on population size. The island’s area is large enough to support healthy population sizes, yet small enough to be manageable.
NEXT
PREVIOUS
1.3Objectives
Objectives
Predict how the population sizes of moose and wolf are related on Isle Royale.
Research population sizes of moose and wolf for the past 50 years and construct a graph to compare the data.
Evaluate how predation limits population size.
Analyze predator/prey relationships to determine how they affect one another.
Consider how warmer temperatures might affect wolf and moose populations.
Terms
Biotic potential – the maximum reproductive capacity of an organism in an environment with unlimited resources.
Logistical growth – growth that starts slowly, then enters an exponentially growth rate phase until it levels off as resources in the environment become scarce.
Exponential growth – increasingly rapid growth in proportion to the increasing total size; occurs when resources are plentiful.
Limiting factors – resources necessary for survival that when scarce reduce future population growth.
Density-independent limiting factors - factors whose effects are the same regardless of population density; ex. Tornados, floods, and tsunamis.
Density-dependant limiting factors – factors whose effects are more pronounced in dense populations; ex. Limited food, water, and space.
Competition – when members of a species struggle to obtain a limited resource.
Predation – When one species eats another.
Predator/prey relationship – a dynamic dependence between 2 species next to each other on a food chain.
Random distribution – when a species has a consistent food supply, they tend to spread out evenly in their habitat.
Clumped distribution – when a species has an inconsistent food supply, they tend to exist in groups that are unevenly spread out in their habitat.
Null hypothesis – in scientific research, a prediction that two variables will have no affect on one another.
Alternative hypotheses – predictions that state how two variables affect one another.
NEXT
PREVIOUS
1.4Skills
Note: Only instructors see this section; it won't be shown to students.
Understand elements of research design and how they impact scientific findings/conclusions (e.g., identify strengths and weaknesses in research that are related to bias, sample size, randomization, and experimental control)
Read and interpret graphical representations of data
Justify inferences, predictions, and conclusions based on quantitative data
Cognitive Levels
Compare/contrast, 4
Predict, 6
Experiment, 4
Construct, 5
Evaluate, 6
Analyze, 4
Connections
Competition
Other predator/prey relationships
Research tools
Climate change
Disease
Research papers
NEXT
PREVIOUS
1.5Make Hypotheses
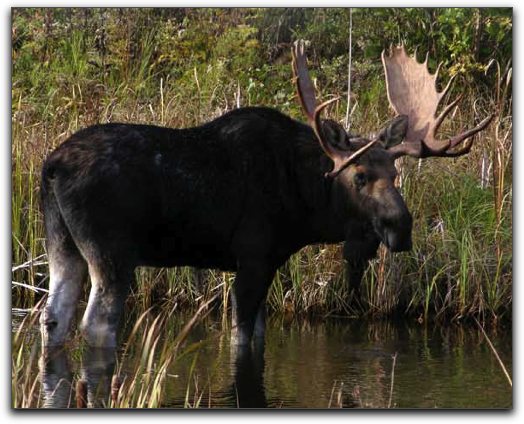
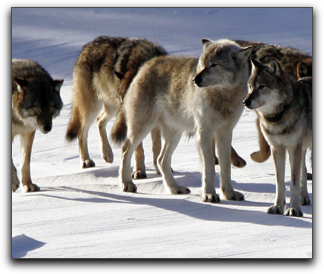
In this exercise you will conduct research on Isle Royale, to decipher the relationships between the populations of moose (Alces alces) and wolves (Canis lupus). You will also take into consideration other organisms in the food chain including moose ticks (Dermacentor albipictus) and trees, particularly balsam fir (Abies balsamea). Finally, you will consider how a warming climate has been having indirect effects on the moose population, and may subsequently affect the wolf population in the future.
Your research question concerns how the population sizes of wolves (predators) and moose (prey) affect one another. A prediction that states that two variables have no effect on one another is called a null hypothesis. Predictions that indicate a relationship between two variables are called alternative hypotheses.
Hypothesis questions
1. What is a null hypothesis?
Which of the following predictions is a null hypothesis?
A.
B.
_max_tries: 2
_credit_after_max_tries: 100
_feedback_correct: Right, this statement indicates that there is no correlation between the moose population and the wolf population, so it is a null hypothesis. Good job.
_feedback_incorrect: No, [insert explanation here...]
2. Make an alternative hypothesis
Make a prediction regarding the relationship between moose and wolves by selecting one of the following alternative hypotheses:
A.
B.
C.
D.
E.
_feedback: Let's test your hypothesis and see how it works out
NEXT
PREVIOUS
1.6Collect Data, Part 1
Now, let’s collect some data to see if your prediction is correct! You will begin your research by viewing aerial photographs to conduct population counts of the wolves and moose. Aerial survey is used to count wolves by flying circular patterns to monitor the entire island. While flying, you will look for wolf tracks that will lead you to the packs.
Moose are 50 times more plentiful on the island than wolves with an average population size ranging between 500-2,500 individuals over the last 50 years. Wolves are far less numerous on the island, with population sizes ranging from 10-50 individuals. Wolves usually exist in packs, displaying a clumped distribution, which makes them easier to count than the moose population, which is spread out in a random distribution pattern. Moose are good fighters so usually it requires a pack of wolves to take one down. Sometimes wolves will break off from the pack and live as loners, often scavenging food.
First, count the wolf population in Isle Royale. Click on the thumbnail map at right to launch the full map view. You'll need to navigate around the island, counting all the wolves you see. Remember: Wolves tend to travel in packs!
3. Total Wolf Count
Total Wolf Count:
_max_tries: 3
_credit_after_max_tries: 100
_feedback_correct: Good job! You successfully counted all of the wolves on Isle Royale.
_feedback_incorrect_first: It looks like you may have missed a few. Make sure you explore the entire island!
_feedback_incorrect: There are 20 wolves on the island. Click "Next" to go on to the next part of the activity.
_question_report_text: Enter wolf count!
NEXT
PREVIOUS
1.7Collect Data, Part 2
Due to the large population size of the moose, it is not feasible to count the entire population. Instead, the 200 sq. mile island is broken into square kilometer plots and about 20% of the island is counted, plot-by-plot. Since moose are randomly distributed, this data can be extrapolated to the entire island. This means that the tabulated number is used to estimate the entire population on the island.
Click on each of the four plots in the thumbnail map at right and count the moose in each plot, then enter your results below.
4. Moose plot counts
Plot 1: Plot 2: Plot 3: Plot 4:
_max_tries: 3
_credit_after_max_tries: 100
_feedback_correct: Good job! You successfully counted all of the moose in these plots.
_feedback_incorrect_first: It looks like you may have missed a few. Make sure you carefully explore each plot.
_feedback_incorrect: There are 8, 12, 5, and 11 moose in plots 1, 2, 3, and 4 respectively. Click "Next" to go on to the next part of the activity.
_question_report_text: Enter moose counts
NEXT
PREVIOUS
1.8Assessment
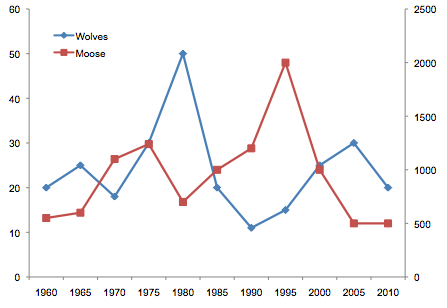
Your graph of wolf and moose populations by year on Isle Royale is shown at right. Now use this graph, along with the knowledge of population dynamics learned in this activity, to answer the following questions.
5.
When the moose population goes up, what generally happens to the wolf population?
A.
B.
C.
6.
When the moose population goes down, what generally happens to the wolf population?
A.
B.
C.
7.
What type of effect, direct or indirect, does the moose population have on the wolf population?
A.
B.
8.
When the wolf population goes up, what happens to the moose population?
A.
B.
C.
9.
When the wolf population goes down, what happens to the moose populations?
A.
B.
C.
10.
What type of effect, direct or indirect, does the wolf population have on the moose population?
A.
B.
11.
Did the data support your hypothesis?
A.
B.
12.
Did the data reject your hypothesis?
A.
B.
13.
Did the data support the null hypothesis?
A.
B.
14.
Did the reject the null hypothesis?
A.
B.
15.
What kind of distribution pattern to wolves display?
A.
B.
C.
16.
Why is Isle Royal a good study site for predator/prey relationships?
A.
B.
C.
D.
17.
What kind of distribution pattern do moose display?
A.
B.
C.
18.
Clumping behavior of wolves gives them a survival advantage because it