Chapter 7. Learning
7.1 Learning
Topic: Do “Learning Styles” Exist?
Statistical Concepts Covered: In this applet, you’ll learn that in some research designs we are interested in looking at and interpreting the main effects and interaction. The main effect is the impact of a single variable on what we are measuring, while the interaction is the combined impact of two main effects on what we are measuring. It is also important to investigate studies that replicate findings to determine the confidence we should have in the results.
Introduction
The Learning chapter covered ways for you to promote your own learning in the classroom. It has long been thought that there are different styles of learners, primarily visual and verbal, and that instructional methods should be tailored to each learner’s strength. The attribute-treatment interaction (ATI) hypothesis states that visual learners do better when provided with visual instruction methods and verbal learners do better when provided with verbal instruction methods. This applet will allow you to explore data that was collected as part of a study investigating this hypothesis (Massa & Mayer, 2006).
A subset of data from the study compares the average scores on a learning test where help was offered either through pictures (pictorial condition) or through words (textual condition). Visual learners (visualizers) were determined based on high scores on spatial ability, visual cognitive style, or visual learning preference, while verbal learners (verbalizers) were determined based on high scores on verbal ability, verbal cognitive style, or verbal learning preference. The study set forth to determine whether there was a difference in learning between visualizers and verbalizers when they were assigned either pictorial or textual help. It was expected that visualizers would learn more in the pictorial condition, while verbalizers would learn more in the textual condition.
Question
1) In studies such as the one being used here we have main effects (the impact of a single variable on what we are measuring) and interactions (the combined impact of two main effects on what we are measuring). Let’s evaluate the main effect of being placed in either the pictorial or textual condition. Overall, how do the pictorial condition learners compare to the textual condition learners? (Pick “General Achievement” as the measurement and “All” as the sub-measure. Remember to evaluate only this main effect, ignoring any impact of learning style.)
| A. |
| B. |
| C. |
| D. |
Question
2) Based on the graph, what can we say about the impact of being a visualizer or verbalizer on learning? Overall, how do the visual learners compare to the verbal learners? (Use the same graph from question 1. Remember to evaluate only this main effect, ignoring any impact of condition.)
| A. |
| B. |
| C. |
| D. |
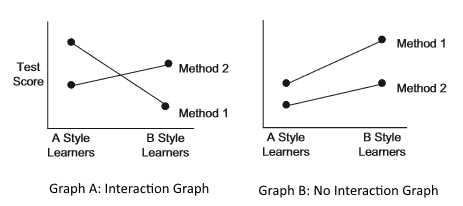
Statistical Lesson: Interactions can be tricky to interpret since we have to take into consideration the combined influence of the main effects. A general rule of thumb in interpreting interaction graphs is to look at whether or not the lines connecting the groups of one of the main effects are parallel or not. The more parallel the lines are, the less likely there is an interaction. While the less parallel or more perpendicular the lines are (they cross each other), the more likely there is an interaction.
Graph A below shows an interaction (lines that cross) and Graph B shows no interaction (lines are closer to being parallel). In Graph A, we can see that a participant’s score depends on the learning method (Method 1 or 2) to which they were exposed and their style group (Group A or B). “A Style Learners” performed better when they utilized Method 1, while “B Style Learners” performed better when they utilized Method 2. It is the combined effect of method and learner style that makes this an interaction.
Meanwhile, in Graph B we see that the lines are close to parallel, which means that the same thing occurred for “A Style Learners” and “B Style Learners”: they increased their test scores regardless of the method to which they were exposed. In this example, we can see that those exposed to Method 1 always performed better than those in Method 2, and that “B Style Learners” always outperformed “A Style Learners.” Each main effect, method and learner style, was significant but there is no interaction or combined influence of both main effects on learning in Graph B.
Be aware that independent variables are referred to as “main effects” in some research designs but they are essentially referring to the same thing. When we state “there is a main effect,” we basically mean that the independent variable was found to have a significant effect on the outcome. If we state that “there is no main effect,” then the independent variable did not have an effect on the outcome, or was not significant.
Question
3) In the previous two questions we evaluated the main effects, now let’s take a look at how to interpret interactions. Using the same graph as before, evaluate and determine whether there is a significant interaction between condition and learner style. Visualize the line connecting the two bars representing the visualizers and the line connecting the two bars representing the verbalizers. Are the lines more parallel or perpendicular?
| A. |
| B. |
| C. |
| D. |
Question
4) Based on what you found in question 3, how would you explain the interaction in relation to learning scores?
| A. |
| B. |
| C. |
| D. |
Question
5) Using the information from questions 1-4, summarize your findings regarding the main effects (i.e., independent variables) and interaction for learning in this study.
| A. |
| B. |
| C. |
| D. |
Question
6) Based on the evidence provided in this study, what conclusion might you draw regarding the ATI hypothesis, which states that the type of instruction should correspond to the style of the learner?
| A. |
| B. |
| C. |
| D. |
Question
7) When building the graphs for the previous questions, we used a combination of measures to compare visualizers and verbalizers in the two conditions. How does this change when we compare them on only one measure? Alter the graph to use “Cognitive Style” as the measurement and “Verbal-Spatial Ability Rating” as the sub-measure. How does this graph compare to when we used all general achievement measures to compare learners?
| A. |
| B. |
| C. |
| D. |
Question
8) In order to support their findings and address a small sample size in the first experiment of this study, Massa and Mayer replicated the experiment with a second sample. The first experiment included 52 college students, while the second experiment included 61 non-college educated adults. Compare the results from the two experiments using “Cognitive Style” as the measurement and selecting “Experiment 1”, then “Experiment 2”. How do the two bar graphs compare in terms of the main effects and interaction?
| A. |
| B. |
| C. |
| D. |
Question
9) Using what you found in question 8, and the knowledge that there were no significant interactions between condition and learning style in either experiment, what did the replication of this study demonstrate?
| A. |
| B. |
| C. |
| D. |
Question
10) You are an instructor creating a new online course teaching statistics to undergraduate students. Based on the findings from this study and its two experiments, what will you consider when designing this multimedia course in terms of the instructional method it utilizes?
| A. |
| B. |
| C. |
| D. |
.