EXAMPLE 1 Declining murder rate in New York City
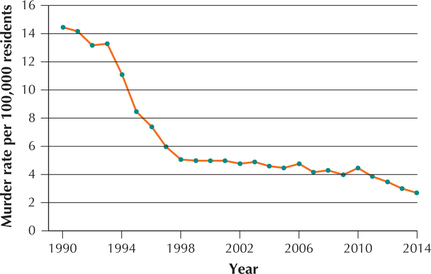
Our Chapter 2 Case Study, Criminal Justice in New York City, examines a wide range of criminal behavior throughout the police precincts of the five boroughs of New York City, from misdemeanors to murder. In this chapter, we briefly preview these data by looking at Figure 1. This figure is a time series plot of the murder rate (number of murders per year per 100,000 residents) for New York City for the years 1990–2014 (Source: New York City Police Department, www.nyc.gov). Note the steep decline from 1993 to 1998, followed by a flattening until 2010, when another slow descent began. Think about what this means: Thousands of men and women are living their lives who would not be alive today had the high murder rates of the early 1990s continued. And this heartening pattern is not restricted to New York City. Major cities across the country are seeing their crime rates drop over this same period (Source: FBI Uniform Crime Reports).
In the Chapter 2 Case Study, we examine other types of crime in New York City and look to see if further good news is available. We learn how to construct a time series plot similar to Figure 1 in Section 2.3.