EXAMPLE 2 UFO sightings
Have you or any of your friends sighted any unidentified flying objects (UFOs)? Americans in each of the 50 states have reported seeing UFOs. Figure 2 represents a scatter-plot of the number of UFO sightings versus state population, for each of the 50 states. Each dot represents a state. The straight line is a regression line that approximates the relationship between UFO sightings and state population. As the state population increases, the number of UFO sightings also tends to increase, which is not surprising.
3
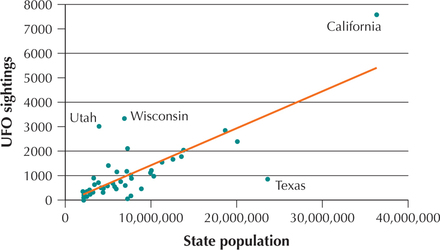
What may be surprising is that the UFOs seem to be attracted to certain states, while avoiding others. States considerably above the regression line have a larger than expected number of UFO sightings for their population size, whereas states below the line have a smaller than expected number of UFO sightings for their population size. So, there are more sightings than expected in California, Wisconsin, and Utah, given their population size, and fewer than expected in Texas. Why this might occur is open to discussion. Perhaps people in California are more likely to attribute unusual sightings to UFOs than most Americans; perhaps people in Texas are more pragmatic than most Americans. But if the sightings are valid (a big if!), it sure looks like the UFOs don't want to mess with Texas. We will learn how to construct and interpret scatterplots in Chapter 4, “Correlation and Regression,” and we will learn how to quantify the relationship between two numerical variables in Chapter 4 and Chapter 13, “Inference in Regression.”