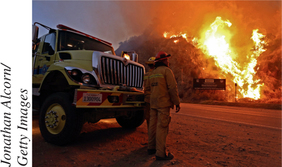
EXAMPLE 3 California wildfires

In 2014, severe drought continued to batter the state of California and large areas of the western United States. The drought contributed to a series of wildfires that consumed hundreds of thousands of acres across the region. Table 1 contains a data set, which includes a listing of the uncontrolled wildfires raging around the state of California as of August 22, 2014. We will learn in Section 1.2 about how data sets are structured. Meanwhile, this is the first data set we look at, which gives us a chance to think about how these fires affected the lives of ordinary Californians: the lives lost, the homes destroyed, the forests and wildlife burned. As statisticians, we should always remember that behind the data lie the stories of real people. As statisticians, we will learn to apply the power of statistical analysis to improve the lives of the people behind the data. Let's get started.
| Fire | Location | Size (acres) | Percent contained |
|---|---|---|---|
| Eiler | Lassen National Forest | 32,416 | 97 |
| Happy Camp Complex |
Klamath National Forest | 9,844 | 10 |
| July Complex | Klamath National Forest | 31,945 | 25 |
| Junction | Merced-Mariposa Unit, Cal Fire | 612 | 65 |
| KNF Beaver | Klamath National Forest | 32,307 | 93 |
| Lodge Complex |
Mendocino National Forest | 12,535 | 95 |
| Log | Klamath National Forest | 3,629 | 95 |
| Way | Central California District | 3,858 | 48 |