EXAMPLE 4 The four phases of statistics: Does Friday the 13th change human behavior?
Superstitions affect most of us. Some people will never walk under a ladder, whereas others will alter their path to avoid a black cat. Do you think that people change their behavior on Friday the 13th? Perhaps, suspecting that it may be unlucky, some people might elect to stay home and watch television instead of venturing outdoors or driving on the highway. How would researchers go about studying whether superstitions change the way people behave? What kind of evidence would support the hypothesis that Friday the 13th causes a change in human behavior? T. J. Scanlon and his co-researchers thought that if fewer vehicles were on the road on Friday the 13th than on the previous Friday, this would be evidence that some people were playing it safe on Friday the 13th and staying off the roads.1 Note that the researchers didn't simply argue about the validity of the Friday the 13th superstition. Such discussions are interesting but largely subjective. What they deemed important is the effect of such a superstition on human behavior and how to measure such an effect as a change in behavior.
6

- Phase 1 Data collection. The first phase of a statistical study, as in the definition of statistics, is to collect the data. The researchers obtained data kept by the British Department of Transport on the traffic flow through certain junctions of the M25 motorway in England.
- Phase 2 Data analysis. Next is the analysis of the data. The authors compared the number of vehicles passing through certain junctions on the M25 motorway on Friday the 13th and the previous Friday.Table 1.2: Table 2 Traffic through M25 junctions
Friday the 6th Friday the 13th Difference 139,246 138,548 698 134,012 132,908 1104 137,055 136,018 1037 133,732 131,843 1889 123,552 121,641 1911 121,139 118,723 2416 128,293 125,532 2761 124,631 120,249 4382 124,609 122,770 1839 117,584 117,263 321 fridaythe13th
Table 2 shows that, in every instance, the number of vehicles passing through these junctions on Friday the 13th was less than on the preceding Friday. Now, let's examine the data graphically. The clustered bar graph in Figure 4 illustrates the difference in the number of vehicles traveling on the M25 motorway on Friday the 6th (in green) and the subsequent Friday the 13th (in yellow) for 10 pairs (clusters) of dates. Note that, in every instance, the green bar is longer than its partner yellow bar. This indicates that the number of vehicles on the motorway decreased on Friday the 13th when compared with the previous Friday in every instance.
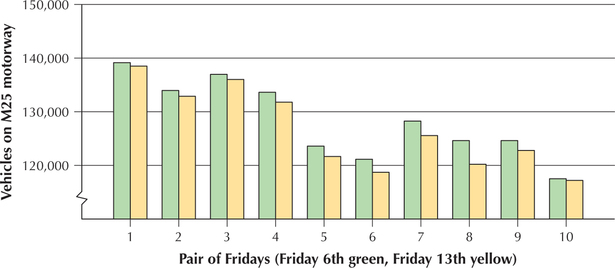 Figure 1.4: FIGURE 4 Clustered bar graph of motorway traffic.
7
- Phase 3 Data presentation. The presentation of the results is important, and the researchers found a highly respectable journal, the British Medical Journal, in which to publish their findings. Other avenues for presentation are delivering a talk at a conference, writing up a report for one's supervisor, or presenting a class project.
- Phase 4 Data interpretation. Finally, the last facet in our definition of statistics is interpretation. It is crucial for those who are performing a statistical study to make their results understandable to the general public. It is not sufficient for the statistician alone to understand the results. Instead, the statistician must communicate the results clearly, whether in writing or orally. In this case, the researchers chose the decrease in number of vehicles as the criterion on which to base support for their hypothesis that people changed their behavior on Friday the 13th. Their finding of an observable decrease in traffic on Friday the 13th is consistent with their hypothesis.