EXAMPLE 15 test for using the critical-value method

In April 2014, the Pew Research Center published a report called U.S. Views of Technology and the Future,15 in which the results of a survey of Americans' views on the future of technology were examined. Among other questions, respondents were asked whether they agreed that “technological changes will lead toward a future where people's lives are mostly better.” The results are shown in Table 13. Assume the samples are independent.
| Males | Females | |
|---|---|---|
| Number agreeing | ||
| Sample size | ||
| Sample proportion | ||
| Population proportion |
- Find the point estimate of the difference in the population proportions of males and females, .
- Compute the pooled estimate of the common proportion, .
- Calculate the value of the test statistic .
- Check whether the conditions for performing the test for are met.
- Test whether the population proportion of males who agree that technology will lead to a better future is greater than the population proportion of females who agree. Use the critical-value method at level of significance .
610
Solution
- The point estimate is
 Figure 10.16: FIGURE 16 TI-83/84 results.
- We check the conditions for performing the test for . We have: , , , and . We may thus proceed with the hypothesis test.
- The test for follows the steps below.
Step 1 State the hypotheses.
The key words “greater than,” together with the fact that sample 1 represents the males, indicate that we have a right-tailed test:
where and represent the population proportion of males and females, respectively, who agree that technology will lead to a better future.
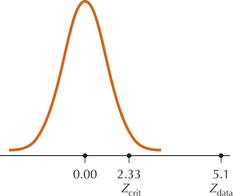
 Figure 10.17: FIGURE 17 is extreme, leading to rejection of .
Step 2 Find and state the rejection rule.
For a right-tailed test with level of significance , Table 12 gives us and our rejection rule: Reject if .
Step 3 Calculate .
From (c), we have (also see Figure 16).
Step 4 State the conclusion and the interpretation.
; therefore, reject (see Figure 17). There is evidence at level of significance that the population proportion of males who agree that technology will lead to a better future is greater than the population proportion of females who agree.
NOW YOU CAN DO
Exercises 5–8.