EXAMPLE 16 Z test for p1−p2 using the p-value method

The General Social Survey tracks trends in American society through annual surveys. Married respondents were asked to characterize their feelings about being married. The results are shown here in a crosstabulation with gender. Test the hypothesis that the proportion of females who report being very happily married is smaller than the proportion of males who report being very happily married. Use the p-value method with level of significance α=0.05.
marriage
| Very happy | Pretty happy/ Not too happy |
Total | |
|---|---|---|---|
| Female | 257 | 166 | 423 |
| Male | 242 | 124 | 366 |
| Total | 499 | 290 | 789 |
Solution
From the crosstabulation, we assemble the statistics in Table 15 for the independent random samples of men and women.
| Sample size | Number very happy |
Sample proportion very happy | |
|---|---|---|---|
| Females (sample 1) | n1=423 | x1=257 | ˆp1=x1n1=257423≈0.6076 |
| Males (sample 2) | n2=366 | x2=242 | ˆp2=x2n2=257423≈0.6612 |
We first check whether the conditions for the Z test are valid: x1=257≥5, (n1−x1)=(423−257)=166≥5, x2=242≥5, and (n2−x2)=(366−242)=124≥5. We can therefore proceed.
Step 1 State the hypotheses and the rejection rule.
We are interested in whether the proportion of females who report being very happily married is smaller than that of males and because the females represent sample 1, the hypotheses are
H0:p1=p2Ha:p1<p2
Page 612where p1 and p2 represent the population proportions of all females and males, respectively, who report being very happily married. We will reject H0 if the p–value≤α=0.05.
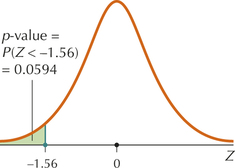 FIGURE 18 p-Value for left-tailed Z test.
Step 2 Find Zdata.
First, use the data from Table 15 to find the value of ˆppooled.
ˆppooled=x1+x2n1+n2=257+242423+366≈0.63245
Then
Zdata=(0.6076−0.6612)√0.63245⋅(1−0.63245)(1423+1366)≈−1.56
Step 3 Find the p-value.
Because it is a left-tailed test, the p-value is given by Table 14 as P(Z<Zdata)=P(Z<−1.56), as shown in Figure 18. This amounts to a Case 1 problem from Table 8 in Chapter 6 on page 357:
P(Z<−1.56)=0.0594
Step 4 State the conclusion and the interpretation.
The p-value=0.0594 is not less than or equal to α=0.05, so we do not reject H0. There is insufficient evidence that the proportion of females who report being very happily married is smaller than the proportion of males who do so.
Note: When the p-value is close to α, many data analysts prefer to simply assess the strength of evidence against the null hypothesis using criteria such as those given in Table 6 in Chapter 9 (page 514).
NOW YOU CAN DO
Exercises 9–12.