EXAMPLE 19 Finding critical values of the distribution
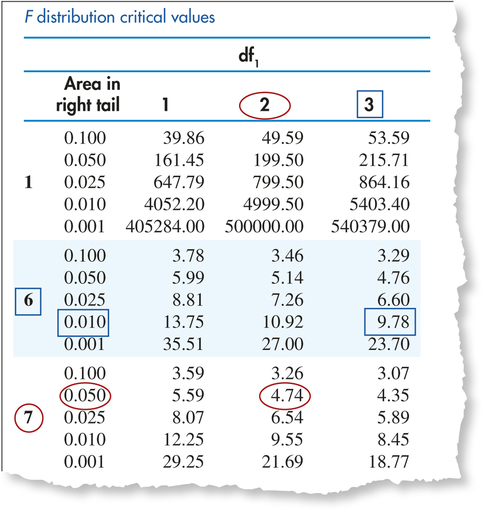
Use the excerpt from the distribution tables in Figure 21 to find the following critical values of the distribution:

Figure 10.21: FIGURE 21 table (excerpt).
- Find the critical value with area to the right of it, for an distribution with and .
- Find the critical value with area to the left of it, for an distribution with and .
Solution
- Step 1. Go across the top of the table until we get to , and go down that column until we see on the left.
Step 2. Next to the 7 is a range of values from 0.100 to 0.001. We choose the row with . The -value in that row and column is 4.74. Thus, our critical value is
621
- Step 1. Switching the two degrees of freedom, we go across the top of the table until we get to . Then we go down that column until we see on the left.
- Step 2. Choose the row with . The -value in that row and column is 9.78. Thus, our critical value is
NOW YOU CAN DO
Exercises 9–20.