EXAMPLE 2 Finding the mean and standard deviation of the sample differences
Table 1 shows students' scores on two statistics quizzes. The “After” row (sample 1) contains scores after the students sought help in the Math Center, and the “Before” row (sample 2) shows scores before they had help. The observations are taken from the same students before and after they had help. Thus, sample 1 and sample 2 are dependent, matched-pair data.
Table 10.1: Table 1 Statistics quiz scores of seven students before and after visiting the Math Center
| Student | Ashley | Brittany | Chris | Dave | Emily | Fran | Greg |
|---|---|---|---|---|---|---|---|
| After (sample 1) | 66 | 68 | 74 | 88 | 89 | 91 | 100 |
| Before (sample 2) | 50 | 55 | 60 | 70 | 75 | 80 | 88 |
- Calculate the sample differences (after – before).
- Explain the key idea behind dependent sampling.
- Find the mean and standard deviation of the sample differences.
Solution
- For each student, we subtract the “before” value from the “after” value. Notice that each student's score improved on the second quiz:
Ashley: Emily: Brittany: Fran: Chris: Greg: Dave: - The key idea behind dependent sampling is that we consider the set of these seven differences {16, 13, 14, 18, 14, 11, 12} as a sample, so that we can perform inference on these differences. In other words, we no longer have two samples. By matching the samples element by element and taking the difference, we have transformed two samples into one that is the sample of differences (Figure 1). We have already learned how to perform inference using a single sample, so the remainder of this section uses techniques you have used previously.
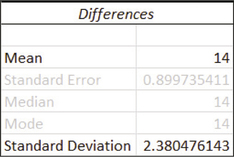
 Excel descriptive statistics.
 - The Excel descriptive statistics show the mean and standard deviation of the differences, giving us
578
 Figure 10.1: FIGURE 1 Taking the differences reduces a two-sample problem to a single sample of differences.
The mean of the differences is shown as the balance point in Figure 1.
NOW YOU CAN DO
Exercises 9–14.