EXAMPLE 20 F test for comparing two population standard deviations: Critical-value method
Table 18 shows independent samples from Google and Apple stock prices from July 2014 together with the sample sizes and sample standard deviations. Test, using the critical-value method, whether the standard deviation of Google stock prices σ1 is greater than the standard deviation of Apple stock prices σ2.
| Apple | |
|---|---|
| 574.79 590.76 583.04 593.06 580.82 599.02 579.55 587.78 |
93.52 94.03 95.39 96.45 95.60 99.02 97.03 |
| n1=8s1≈7.999701 | n2=7s2≈1.862594 |
Solution
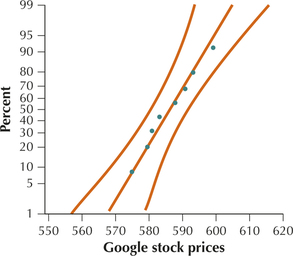
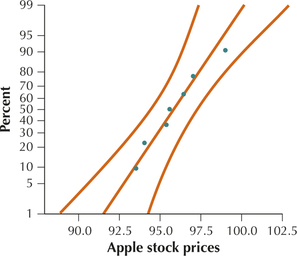
The normal probability plots in Figures 22a and 22b show acceptable normality for both samples. We may, therefore, proceed with the F test for comparing population standard deviations.


Step 1 State the hypotheses. We are testing whether Google's stock prices are more variable than those of Apple. Thus, because Google represents population 1, we have the following hypotheses for our F test:
H0:σ1=σ2versusHa:σ1>σ2
where σ1 represents the standard deviation of Google stock prices and σ2 represents the standard deviation of Apple stock prices. Use level of significance α=0.05.
Step 2 Find the critical value and state the rejection rule. We have df1=n1−1=7 and df2=n2−1=6. From Table 17 and Appendix Table F, our critical value is the F-value with area α=0.05 to the right of it:
Fcrit=Fα,n1−1,n2−1=F0,0.5,7.6=4.21
Our rejection rule is, therefore, from Table 17: Reject H0 if Fdata>4.21.
Page 623Step 3 Find Fdata
Fdata=S21S22=7.99970121.8625942≈18.45
follows an F distribution with df1=n1−1=n1−1=7 and df2=n2−1=n2−1=6.
- Step 4 State the conclusion and the interpretation. Because Fdata≈18.45 is greater than Fcrit=4.21, we reject H0. There is evidence that the variability in Google stock prices is greater than the variability in Apple stock prices.
NOW YOU CAN DO
Exercises 21–26.