EXAMPLE 21 Test for comparing two population standard deviations: -value method
The Web site Medicare.gov publishes survey information on patient attitudes about their level of care. Table 20 shows the percentages of respondents taken from independent random samples of hospitals in Florida and Georgia, which reported that their nurses always communicated well.
624
| Florida | Georgia |
|---|---|
| 67 66 70 70 72 73 | 72 75 78 73 68 71 |
| 63 69 65 68 65 | 82 72 77 75 73 |
Test whether there is a difference in variability between the two states, using .
Solution
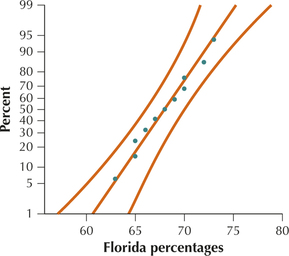
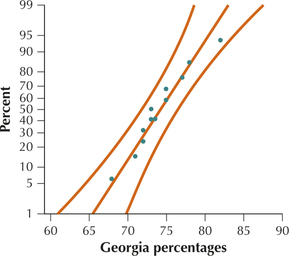
Because the normal probability plots in Figures 23a and 23b show acceptable normality, we may therefore proceed with the test for comparing population standard deviations.


Step 1 State the hypotheses. We are testing whether there is a difference in the standard deviation of the percentages for Florida () and Georgia (). We therefore have a two-tailed test:
where and represent the standard deviations of the percent of Florida and Georgia respondents, respectively, who reported that their nurses always communicated well. Use level of significance .
Step 2 Find .
follows an distribution with and .
Step 3 Find the -value. Because we have a two-tailed test, Table 19 states that the -value is
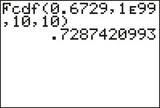
Figure 24a shows the output from the TI-83/84, giving as the area under the distribution curve between 0.6729 and infinity. This gives
 Figure 10.26: FIGURE 24a
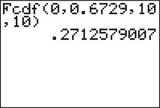
This cannot represent a valid -value, because it is larger than 1. Figure 24b shows the output from the TI-83/84, giving as the area under the distribution curve between 0 and 0.6729. Thus, our -value is:
because this is smaller than 1.457484199.
 Figure 10.27: FIGURE 24b
625
- Step 4 State the conclusion and the interpretation. The -value 0.5425 is not less than , so we do not reject . There is insufficient evidence for a difference in population standard deviations between percentages of patients in Florida and Georgia hospitals who reported that their nurses always communicated well.
NOW YOU CAN DO
Exercises 27–32.