EXAMPLE 3 Paired t test using the critical-value method
For the Math Center data in Example 2, test, at level of significance α=0.05, whether the population mean μd of the differences in quiz scores (after – before) is greater than zero. Or, more informally, test whether the quiz scores after visiting the Math Center are larger on average than the quiz scores before visiting the Math Center.
Solution
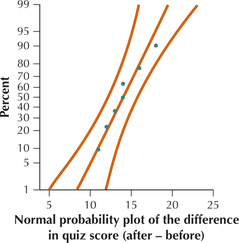
The normal probability plot of the differences shown here shows acceptable normality, allowing us to proceed with the hypothesis test.
Step 1 State the hypotheses. “Greater than” implies that μ, leading to the hypotheses
where represents the population mean difference in quiz scores after visiting the Math Center and before visiting the Math Center.
- Step 2 Find the critical value and state the rejection rule. Use degrees of freedom. Here , so . We have a right-tailed test with , so we find our critical value by choosing the column in the table (Table D in the Appendix) with area 0.05 in one tail: . The right-tailed test tells us that our rejection rule is to reject when is greater than 1.943.
Step 3 Find . We need to calculate and .
From Example 2, we have
This gives
- Step 4 State the conclusion and the interpretation. Because is greater than , we reject . There is evidence that the population mean of the differences in quiz score (after – before) is greater than zero. That is, the quiz scores after visiting the Math Center are larger on average than the quiz scores before visiting the Math Center.
NOW YOU CAN DO
Exercises 15–17.