EXAMPLE 4 Paired sample test for : the -value method
A study was performed to determine whether Reiki touch therapy was useful in the reduction of mean pain level in chronic pain sufferers, including cancer patients.3 The pain level reported by a random sample of 13 patients before and after Reiki touch therapy is shown in Table 5. Test whether a mean reduction in pain level has occurred after the Reiki therapy, using level of significance . In other words, test whether the population mean difference is less than zero, where is defined as the (after – before) difference in pain level.
reiki
581
| Patient | 1 | 2 | 3 | 4 | 5 | 6 | 7 | 8 | 9 | 10 | 11 | 12 | 13 | ||
|---|---|---|---|---|---|---|---|---|---|---|---|---|---|---|---|
| Alter | 3 | 1 | 0 | 0 | 2 | 1 | 2 | 1 | 0 | 4 | 1 | 4 | 8 | ||
| Before | 6 | 2 | 2 | 3 | 3 | 4 | 2 | 5 | 1 | 6 | 6 | 4 | 8 | ||
| Difference | -3 | -1 | -2 | -3 | -1 | -3 | 0 | -4 | -1 | -2 | -5 | 0 | 0 |

Solution
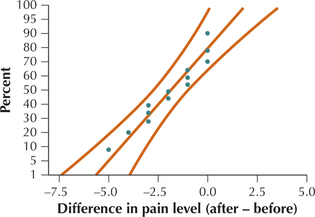
For each patient, we subtract the “before” pain level from the “after” pain level to arrive at a set of differences, highlighted in Table 5. The normal probability plot of the differences indicates acceptable normality, given the small sample size. The Minitab results from the test are provided here.


Step 1 State the hypotheses and the rejection rule. We are interested in testing whether a mean reduction in pain level occurred, which would mean that the mean pain level would be lower after the Reiki therapy than before the therapy. This implies that the population mean difference in pain level, , is less than 0. Thus, from Table 4, the hypotheses are
where represents the population mean difference in pain level. We will reject if the -value < 0.05.
Step 2 Find . As provided in the Minitab results,
which follows an approximate distribution with degrees of freedom .
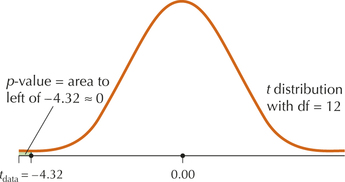
Step 3 Find the -value. For a left-tailed test, the -value is the area to the left of . This area is essentially 0, as shown in Figure 2 and provided by Minitab,
582
 Figure 10.2: FIGURE 2 The
.- Step 4 State the conclusion and the interpretation. Because , we reject . There is evidence that , thus the population mean difference in pain level (after – before) is negative. That is, there is evidence, at level of significance , that the Reiki touch therapy has worked to reduce the mean pain level for chronic pain sufferers.
NOW YOU CAN DO
Exercises 18–20.