EXAMPLE 8 t Test for μ1−μ2 using the p-value method
bankloans
Note: Our degrees of freedom, the smaller of n1−1 and n2−1, is 100−1=99. However, the TI-83/84 output on the next page shows df=143.2490465. Why does the technology use different degrees of freedom than we do? Recall that we are using Welch's approximation to the t distribution. The TI-83/84, Excel, Minitab, and other technology calculate the degrees of freedom as follows:7
df=(s21n1+s22n2)2(s21n1)2n1−1+(s22n2)2n2−1
This provides a more accurate determination of the degrees of freedom than our method. However, our method is a conservative estimate that is easier to calculate, and it is recommended for hand calculations.
 Bank Loans
Here, we do some analysis on our Chapter 10 Case Study data set: Bank loans. When evaluating loan applicants for approval of a loan, banks examine several aspects of an applicant's financial history. Of particular importance is the applicant's credit score. Here, we will look for differences in the mean credit score between applicants who were approved and those who were denied. Independent samples of size 100 were taken from the Bank loans data set, from among those approved and those denied the loan. The descriptive statistics for each group are shown in Table 10. Use the TI-83/84 or Excel, the p-value method, and level of significance α=0.01 to test whether the population mean credit score for successful loan applicants is greater than that for those who were denied the loan.
| Loan Status | Sample size | Sample mean credit score |
Sample standard deviation |
Population mean credit score |
|---|---|---|---|---|
|
Approved (sample 1) |
n1=100 | ˉx1=708 | s1=34 | μ1=? |
|
Denied (sample 2) |
n2=100 | ˉx2=635 | s2=70 | μ2=? |
Solution
Because both samples are large (n1=n2=100≥30), we may proceed with the t test for μ1−μ2.
Step 1 State the hypotheses and the rejection rule.
The approved applicants represent sample 1, and we are interested in whether the mean credit score for the approved applicants is greater than that of the denied applicants. Thus, we have the following hypotheses:
H0:μ1=μ2versusHa:μ1>μ2
where μ1 and μ2 represent the population mean credit score for the approved and denied loan applicants, respectively. The rejection rule is to reject H0 if p-value ≤ 0.01.
Step 2 Find tdata.
We use the instructions provided in the Step-by-Step Technology Guide at the end of this section. From Figure 12,
tdata=(ˉx1−ˉx2)√s21n1+s22n2≈(708−635)√342100+702100≈9.38
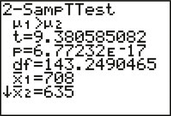 FIGURE 12 TI-83/84 output.
Step 3 Find the p-value.
From Figure 12,
p−value=P(t>tdata)=P(t>9.38)≈0.0000000000000000677≈0
Step 4 State the conclusion and the interpretation.
Our p-value of essentially zero is smaller than the level of significance 0.01. Therefore, we reject H0. There is evidence that the population mean credit score for approved applicants is greater than that of the denied loan applicants. In fact, with a p-value so close to zero, the evidence is very strong indeed.
Remember that when the TI calculator gives you output such as “E-17,” it is indicating that the decimal point needs to be moved 17 places to the left.
NOW YOU CAN DO
Exercises 7–10.