Question 10.193
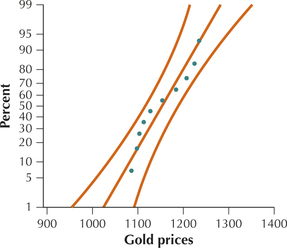
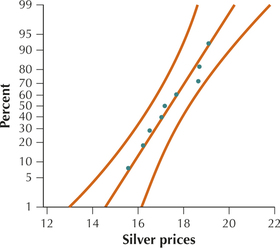
37. Gold and Silver Prices. We are interested in testing whether the variability in gold prices exceeds that of silver prices. Refer to the following data, which represent random samples of the prices taken between June 2009 and July 2010, and the following normal probability plots.
gold
silver
- Do the probability plots indicate violation of the normality assumption?
Gold 1121.5 1128 1086.8 1098.25 1114 1104.25 1123.5 1154.5 1185 1236 1227.75 1225 1234 1208 
Silver 17.17 18.52 16.23 15.57 16.50 17.02 17.69 18.27 18.71 19.11 18.30 18.42 18.65 18.42 
- Test whether the population standard deviation of gold prices is greater than that of silver prices, using . Assume that the samples are independent.
10.4.37
(a) No (b) Critical-value method: . . Reject if . . Since is ≥ 4.16, we reject . There is evidence at the level of significance that the population standard deviation of gold prices is greater than the population standard deviation of silver prices. method: . Reject if the . . Since the is ≤ 0.01, we reject . There is evidence at the level of significance that the population standard deviation of gold prices is greater than the population standard deviation of silver prices.