Question 10.194
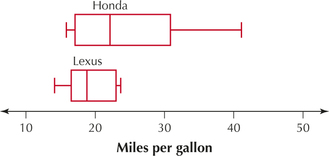
38. Miles per Gallon. The following data represent the combined (city and highway) fuel efficiency in miles per gallon (mpg) for independent random samples of models manufactured by Honda and Lexus.
| Honda car | mpg | Lexus car | mpg |
|---|---|---|---|
| Accord | 24 | GX 470 | 15 |
| Odyssey | 18 | LS 460 | 18 |
| Civic Hybrid | 42 | RX 350 | 19 |
| Fit | 31 | IS 350 | 20 |
| CR-V | 23 | GS 450 | 23 |
| Ridgeline | 17 | IS 250 | 24 |
| S2000 | 21 |
- The boxplots represent the miles per gallon for each manufacturer. Based on this graph, would you expect that the standard deviations of the two manufacturers are the same or different? Why?
- Note: Normal probability plots indicate that the normality assumption is not violated. Test whether the population standard deviations of the two manufacturers' fuel efficiency differ, using .
