EXAMPLE 5 p-Value method for the χ2 goodness of fit test using technology
Table 5 contains the distribution of violent crime in New York City in 2012.2 Suppose that a random sample of 1000 violent crimes in New York City yielded the counts shown in Table 6. Test whether the population proportions have changed since 2012, using the p-value method and level of significance α=0.05.
| Murder | Rape | Robbery | Assault |
|---|---|---|---|
| 0.01 | 0.04 | 0.35 | 0.60 |
| Murder | Rape | Robbery | Assault |
|---|---|---|---|
| 6 | 50 | 350 | 594 |
Solution
- Step 1 State the hypotheses and the rejection rule. Check the conditions.
H0: pMurder=0.01, pRape=0.04, pRobbery=0.35, pAssault=0.60Ha: The random variable does not follow the distribution specified in H0
Reject H0 if the p-value ≤0.05.
What Results Might We Expect?
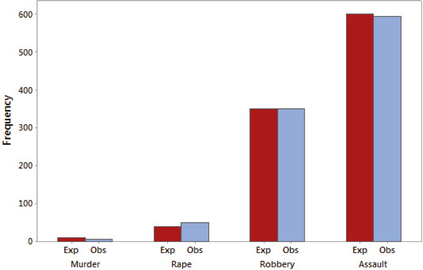
Before we do the formal hypothesis test, let's try to figure out what the conclusion might be. Figure 4 is a clustered bar graph (see Section 2.1) of the observed and expected frequencies for each of the four categories. If H0 were true, then, for each category, we would expect the red bars (observed frequencies) and blue bars (expected frequencies) to have somewhat similar heights. In fact, the heights of the bars are fairly similar for all four categories, indicating not much difference between the crimes that were observed and the crimes that were expected. Thus, we might expect to not reject H0.
First, we need to find the expected frequencies. We have n=1000, so the expected frequencies are as shown here.
| Category | Expected frequencyi=Ei=n·pi |
|---|---|
| Murder | EMurder=1000·0.01=10 |
| Rape | ERape=1000·0.04=40 |
| Robbery | ERobbery=1000·0.35=350 |
| Assault | EAssault=1000·0.60=600 |
Next, check the conditions for this test. Because (a) none of the expected frequencies is less than 1 and (b) no more than 20% of the expected frequencies are less than 5, we may proceed. We use the instructions provided in the Step-by-Step Technology Guide at the end of this section.
Step 2 Find the test statistic χ2data. The TI-83/84 results in Figure 5 tell us that
χ2data=4.16
Step 3 Find the p-value. Figure 5 also tells us that
p-value=P(χ2>4.16)=0.2446972817≈0.2447
This p-value, for the χ2 distribution with 3 degrees of freedom, is shown in Figure 6.
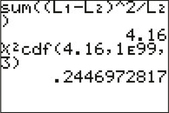 FIGURE 5 χ2data=4.16 has p-value 0.2447.
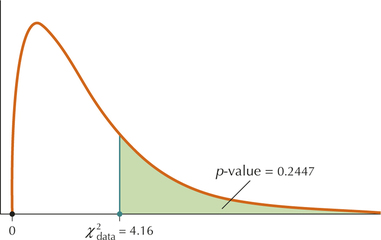 FIGURE 6
Figure 7a shows the TI-84 output for the test, and Figure 7b shows the SPSS output for the test, confirming our test statistic of 4.16 and p-value of 0.2447.
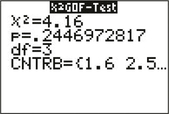 FIGURE 7a χ2 test on TI-84.
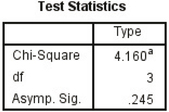 FIGURE 7b χ2 test in SPSS.
- Step 4 State the conclusion and the interpretation. The p-value is not less than α=0.05, so we do not reject H0, which we expected. There is insufficient evidence, at a level of significance α=0.05, that the population proportions of violent crime have changed in New York City since 2012.
NOW YOU CAN DO
Exercises 23–26.