EXAMPLE 7 Performing the test for independence using the critical-value method
Using Table 7, test whether age group is independent of response, using level of significance .
Solution
Step 1 State the hypotheses and check the conditions.
- .
- .
We note from Table 8 that none of the expected frequencies are less than either 1 or 5. Therefore, the conditions are met, and we may proceed with the hypothesis test.
See Figure 1 (page 638) to review how to find .
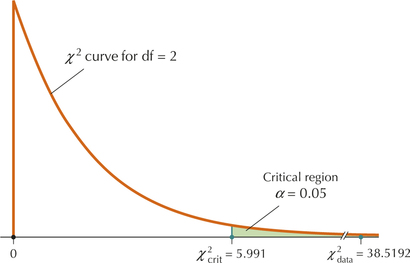
Step 2 Find the critical value and state the rejection rule. The row variable, response, has three categories, so . The column variable, age group, has two categories, so Thus,
With level of significance , this gives us from the table. The rejection rule is therefore
Step 3 Calculate . The observed frequencies are found in Table 7 and the expected frequencies are found in Table 8. Then
- Step 4 State the conclusion and the interpretation. Our of 38.5192 is greater than our of 5.991 (see Figure 16), and so we reject . The interpretation is: “There is evidence at level of significance that age group and response are dependent.”
650
 Figure 11.17: FIGURE 16 lies in the critical region.
NOW YOU CAN DO
Exercises 11–14.