EXAMPLE 8 χ2 test for independence using the p-value method and technology
youngliving
The National Center for Health Statistics publishes information on the living arrangements of America's young people. Table 9 contains a random sample of 200 young people ages 1-24, indicating their gender and living arrangements. Test whether gender and living arrangement are independent, using the TI-83/84, Minitab, JMP, the p-value method, and level of significance α=0.10.
| Living arrangements | ||||
|---|---|---|---|---|
| Gender | Living with parents |
Living with partner |
All other arrangements |
Total |
| Female | 51 | 22 | 28 | 101 |
| Male | 58 | 14 | 27 | 99 |
| Total | 109 | 36 | 55 | 200 |
Solution
Step 1 State the hypotheses and the rejection rule. Check the conditions.
- H0: Gender and living arrangements are independent.
- Ha: Gender and living arrangements are dependent.
Reject H0 if the p-value ≤0.10.
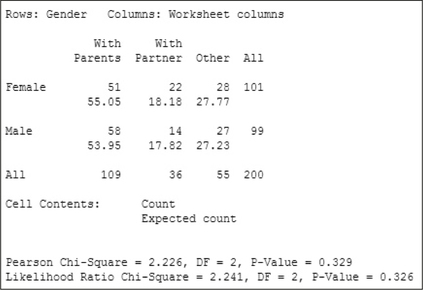
Note that Minitab provides the expected counts (frequencies) below the observed counts. We can then verify that none of the expected frequencies is less than 1, and that none of the expected frequencies has a value less than 5.
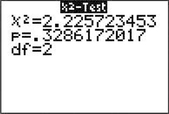
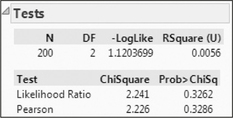
Step 2 Calculate χ2data. We use the instructions found in the Step-by-Step Technology Guide at the end of this section. The TI-83/84 results in Figure 17 tell us that χ2data=2.225723453. The Minitab results in Figure 18 round this to “Pearson Chi-Square”=χ2data=2.226 The JMP results in Figure 19 (“Pearson”) also round this to “ChiSquare”=χ2data=2.226.
 FIGURE 17 TI-83/84 χ2 results.
 FIGURE 18 Minitab χ2 results.
 FIGURE 19 JMP χ2 results.
Step 3 Find the p-value. From the TI-83/84 results in Figure 17, we have
p-value=P(χ2>χ2data)=0.3286172017≈0.329.
- Step 4 State the conclusion and the interpretation. Because p-value ≈ 0.329 is not less than level of significance 0.10, we do not reject H0. There is insufficient evidence that gender and living arrangements are dependent.
NOW YOU CAN DO
Exercises 15–18.