EXAMPLE 10 One-way ANOVA unable to find significance
finalexam
Use technology to perform a one-way ANOVA, using level of significance , to determine whether the population mean test grades for the three learning methods are all the same.
Solution
If we ignore the blocking factor course, Table 6 becomes Table 7.
| Learning method | ||
|---|---|---|
| In-class | Online | Hybrid |
| 75 | 70 | 69 |
| 80 | 77 | 82 |
| 72 | 69 | 72 |
| 73 | 60 | 66 |
| 88 | 82 | 85 |
695
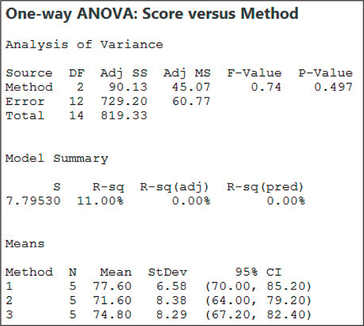
Figure 29 shows acceptable normality, and the largest of the standard deviations in the ANOVA output in Figure 30 and Figure 31 is not larger than twice the smallest.


Thus, we may proceed with the ANOVA. The hypotheses are
Reject if the .
The -value from Figure 30 is 0.497, which is not ≤0.05; therefore, we do not reject . There is insufficient evidence at level of significance that the population mean test performance differs among the three learning methods.