EXAMPLE 13 Constructing an interaction plot
mobilephone
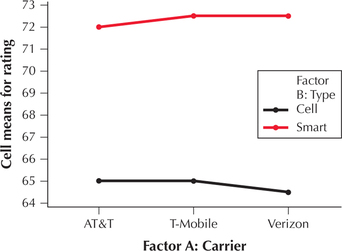
Construct the interaction plot for the data in Table 9.
Solution
We have already calculated the cell means in Table 10. We then use the instructions in the Step-by-Step Technology Guide to construct the interaction plot in Minitab, shown here in Figure 37.

Figure 12.37: FIGURE 37 Interaction plot for phone ratings.
NOW YOU CAN DO
Exercises 9–16.