EXAMPLE 14 Performing a two-way ANOVA
cellsmartphone
Perform a two-way ANOVA for the cell phone and smartphone ratings data in Table 9, using level of significance . Assume the requirements are met.
Solution
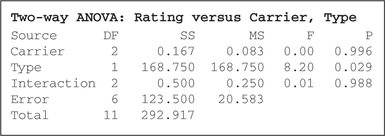
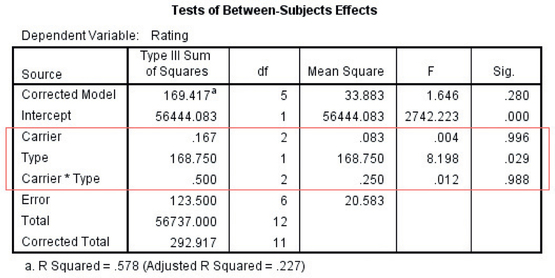
The Minitab results are provided in Figure 39, and the SPSS results are provided in Figure 40.


The null hypothesis in the test for interaction always states that there is no interaction between the factors.
Step 1 Test for interaction. The hypotheses are:
Reject if the . The -value in the Interaction row in Figure 39 is 0.988, which is not ≤0.05; therefore, do not reject . There is insufficient evidence of interaction between carrier and type at level of significance . Therefore, we may proceed with the tests for the main effects.
705
Step 2 Test for Factor A. The hypotheses are:
Reject if the . According to the two-way ANOVA table in Figure 39:
- -value in the Carrier (Factor A) row = 0.996, which is not ≤0.05
Therefore, we do not reject . There is insufficient evidence for a carrier (Factor A) effect. Thus, we do not find a statistically significant difference in Consumer Reports ratings among the three carriers, AT&T, T-Mobile, and Verizon.
Step 3 Test for Factor B. The hypotheses are
Reject if the . The -value in the type (Factor B) row in Figure 39 is 0.029, which is ≤0.05; therefore, reject . There is evidence for a type (Factor B) effect. Thus, we can conclude that there is significant difference in Consumer Reports ratings between the types: cell phones versus smartphones.
NOW YOU CAN DO
Exercises 17–20.