EXAMPLE 4 Performing one-way ANOVA using the p-value method
Test, using level of significance α=0.05, whether the population mean GPAs from Example 1 differ among the students in Dormitories A, B, and C.
What Result Might We Expect?
Recall that the comparison dotplot in Figure 1 (page 667) showed a large amount of overlap in the GPAs among dormitories A, B, and C. The large ranges illustrate the large within-dormitory spread of the GPAs for these dorms. When compared against this large within-sample variability, the variability in sample means may not seem large. Therefore, we might expect that the null hypothesis of no difference will not be rejected.
Solution
We already verified the requirements for performing the analysis of variance in Example 1.
Step 1 State the hypotheses, and state the rejection rule. Define the μi.
H0:μA=μB=μCversusHa:not all the population means are equal
where μi represents the population mean GPA of students from dormitory i. The rejection rule is Reject H0 if the p–.
Step 2 Calculate . From Example 3, we have MSTR = 0.9, MSE = 1.0751407407, and
follows an distribution with and .
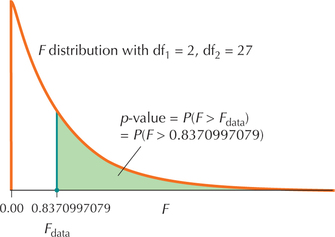
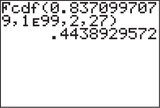
- Step 3 Find the -value. We use the instructions provided in the Step-by-Step Technology Guide at the end of this section (page 679). From Figures 7 and 8, we have
 FIGURE 7 .
 FIGURE 8 TI-83/84 -value.
 - Step 4 State the conclusion and the interpretation. Compare the -value with . The -value of 0.4439 is not , so we do not reject . As expected, there is not enough evidence to conclude at level of significance that not all population mean GPAs are equal.
 When calculating the -value for analysis of variance, always retain as many decimal places in the value of as you can. This will make the -value as accurate as possible. Rounding too much will make the -value less accurate.
NOW YOU CAN DO
Exercises 23–28.