EXAMPLE 8 Tukey's test for multiple comparisons
In the Case Study on page 678, we tested whether the population mean student motivation scores were equal for the three types of professor self-disclosure on Facebook: high, medium, and low. Figure 18 on page 678 contains the ANOVA results, for which we rejected the null hypothesis of equal population mean scores. Use Tukey's method to determine which pairs of population means are significantly different, using level of significance .
Solution
Tukey's method has the same requirements as the Bonferroni method:
- the requirements for ANOVA have been met, and
- the null hypothesis that the population means are all equal has been rejected.
In the Case Study, both requirements were verified.
Step 1 For each of the hypothesis tests, state the hypotheses. There are means, so there will be hypothesis tests. Our hypotheses are:
- Test 1:
- Test 2:
- Test 3:
where represents the population mean score, for the th category.
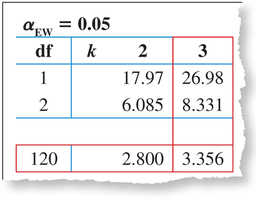
Step 2 Find the Tukey critical value and state the rejection rule. The total sample size is . Use experimentwise error rate , degrees of freedom , and . Using the table of Tukey critical values (Table G in the Appendix), we seek on the left, but, when we don't find it, we conservatively choose df = 120. Then, in the column for , we find the Tukey critical value (Figure 23). The rejection rule for the Tukey method is “Reject ,” that is, Reject if .
 Figure 12.23: FIGURE 23 Finding the Tukey critical value .
689
- Step 3 Calculate the Tukey test statistic for each hypothesis test. From Figure 18 on page 678, we get the sample means, the sample sizes, and the mean square error MSE = 168. Thus,
- Test 1:
- Test 2:
- Test 3:
- Test 1:
- Step 4 For each hypothesis test, state the conclusion and the interpretation.
- Test 1: , which is not ; therefore, do not reject . There is insufficient evidence at the 0.05 level of significance that the population mean student motivation scores differ between professors having high and medium self-disclosure on Facebook.
- Test 2: , which is ; therefore, reject . There is evidence at the 0.05 level of significance that the population mean scores differ between high and low professor self-disclosure on Facebook.
- Test 3: , which is ; therefore, reject . There is evidence at the 0.05 level of significance that the population mean scores differ between medium and low professor self-disclosure on Facebook.
This set of three hypothesis tests has an experimentwise error rate .
When calculating the numerator of for each pairwise comparison, be sure to subtract the smaller value of from the larger value of , so that the value of is positive.
NOW YOU CAN DO
Exercises 19–30.