EXAMPLE 9 Using confidence intervals to perform Tukey's test
Use the 95% confidence intervals for the differences in population means provided by Minitab to perform Tukey's test for multiple comparisons on the Facebook data.
Solution
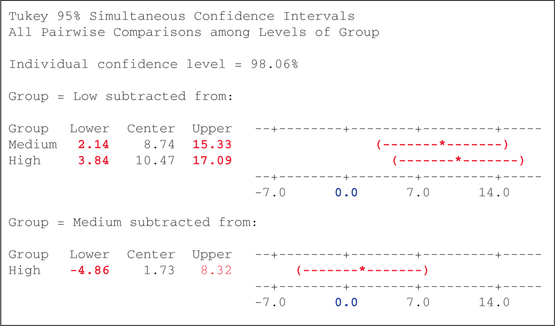
We use the steps in the Step-by-Step Technology Guide provided at the end of this section. Figure 24 contains the output from Minitab showing 95% confidence intervals for the differences in population means for the high, medium, and low professor disclosure levels. The output states that “Group = Low” is being subtracted from the other two groups, meaning that the first two confidence intervals are for and . Later, “Group = Medium” is subtracted from the high group, indicating a confidence interval for . The column headings “Lower” and “Upper” represent the lower and upper bounds of the confidence interval. Figure 25 shows the output from JMP, including 95% confidence intervals for the differences in population means. The output states that the second level listed is subtracted from the first, meaning that the first two confidence intervals are for and . The columns “Lower CL” and “Upper CL” represent the lower and upper bounds of each confidence interval.


Thus, for our hypothesis tests, we have
Test 1:
95% confidence interval for is (2.14, 15.33), which does not contain zero, so we reject for level of significance .
Test 2:
95% confidence interval for is (3.84, 17.09), which does not contain zero, so we reject for level of significance .
691
Test 3:
95% confidence interval for is (–4.86, 8.32), which does contain zero, so we do not reject for level of significance .
Note that these conclusions are exactly the same as the conclusions from Example 8.
NOW YOU CAN DO
Exercises 31 and 32.