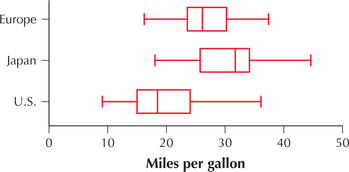
Gas Mileage for European, Japanese, and American Cars. Use this information for Exercises 48–50. The following figure shows a comparison boxplot of the vehicle mileage (in mpg) for random samples of automobiles manufactured in Europe, Japan, and the United States. The summary statistics are provided. We are interested in testing, using , whether population mean gas mileage differs among automobiles from the three regions. Assume that the assumptions are satisfied.

| MPG | Sample 1: Europe |
Sample 2: Japan |
Sample 3: USA |
|---|---|---|---|
| Sample mean | |||
| Sample standard deviation |
|||
| Sample size |
Question 12.48
48. What Result Might We Expect?
- Based on the graphical evidence in the comparison boxplot, what might be the conclusion? Explain your reasoning.
- Perform the ANOVA, using whichever method you prefer.
- Is your intuition from (a) supported?