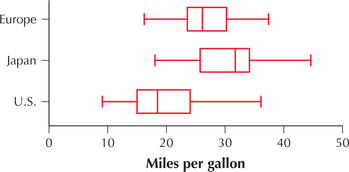
Gas Mileage for European, Japanese, and American Cars. Use this information for Exercises 48–50. The following figure shows a comparison boxplot of the vehicle mileage (in mpg) for random samples of automobiles manufactured in Europe, Japan, and the United States. The summary statistics are provided. We are interested in testing, using , whether population mean gas mileage differs among automobiles from the three regions. Assume that the assumptions are satisfied.

| MPG | Sample 1: Europe |
Sample 2: Japan |
Sample 3: USA |
|---|---|---|---|
| Sample mean | |||
| Sample standard deviation |
|||
| Sample size |
Question 12.49
49. Confidence Intervals as Further Clues in ANOVA. Refer to Exercise 48. Suppose we construct a confidence interval for each of the population means. If at least one confidence interval does not overlap the others, then it is evidence against the null hypothesis.
685
- Use a interval from Section 8.2 to construct a 99% confidence interval for the population mean gas mileage of
- European cars
- Japanese cars
- American cars
- Is there one confidence interval from (a) that does not overlap the other two? If so, what does this mean in terms of the null hypothesis that all the population means are equal?
12.1.49
(a) (i) (25.4805, 29.7255) (ii) (28.6366, 32.2654) (iii) (18.9526, 21.1134). (b) The confidence interval for the population mean gas mileage of American cars does not overlap the other two confidence intervals. This is evidence against the null hypothesis that all the population means are equal.