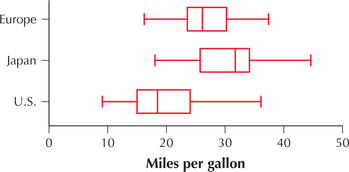
Gas Mileage for European, Japanese, and American Cars. Use this information for Exercises 48–50. The following figure shows a comparison boxplot of the vehicle mileage (in mpg) for random samples of automobiles manufactured in Europe, Japan, and the United States. The summary statistics are provided. We are interested in testing, using , whether population mean gas mileage differs among automobiles from the three regions. Assume that the assumptions are satisfied.

| MPG | Sample 1: Europe |
Sample 2: Japan |
Sample 3: USA |
|---|---|---|---|
| Sample mean | |||
| Sample standard deviation |
|||
| Sample size |
Question 12.50
 50. Refer to the table of descriptive summaries of vehicle mileage. What if we discovered that we made a mistake in the data collection and that every Japanese vehicle tested actually had 1 mpg higher gas mileage than previously recorded? Explain how and why this change would affect the following measures—increase, decrease, or no change.
- SSTR
- SSE
- SST
- MSTR
- MSE
- -value
- Conclusion