EXAMPLE 1 Review of regression topics
textms
The Nielsen company has reported that the number of text messages that a person sends tends to decrease with age. Table 1 contains a random sample of 10 people, along with their age and the number of text messages they sent on the previous day.
- Construct and interpret a scatterplot of the response variable versus the predictor variable .
- Calculate and interpret the correlation coefficient .
- Compute the regression equation . Interpret the meaning of the intercept and the slope of the regression equation.
- Predict the number of text messages sent by a 20-year-old person, and calculate the prediction error (residual).
| 18 | 35 | 28 | 16 |
| 20 | 29 | 30 | 19 |
| 22 | 27 | 32 | 12 |
| 24 | 28 | 34 | 8 |
| 26 | 19 | 36 | 8 |
You may want to refer to Section 4.1 for (a) and (b), and Section 4.2 for (c) and (d).
Solution
- The number of messages depends on age, and not vice versa, so the predictor variable is age and the response variable is messages. Also, note that in (d) we are trying to predict the number of text messages, which tells us that messages is the response variable because we never try to predict the known value of . The TI-83/84 scatterplot is shown in Figure 1. As age increases, the number of messages tends to decrease.
717
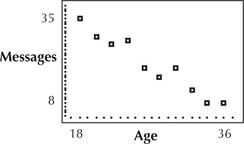 Figure 13.1: FIGURE 1 TI-83/84 scatterplot of messages versus age.
 - Figure 2 shows the correlation coefficient , calculated by the TI-83/84. Age and messages are negatively correlated. An increase in age is associated with a decrease in the number of messages.
Figure 2 shows that and , and thus the regression equation is
We can interpret and as follows:
- The intercept is the estimated number of text messages sent by someone aged , which does not make sense because this value lies far below the minimum value of and therefore represents extreme extrapolation.
- The slope means there is an estimated decrease of 1.5 in the number of text messages for each additional year of age.
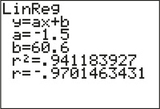 Figure 13.2: FIGURE 2 TI-83/84 correlation and regression results.
For a 20-year-old person, the estimated number of daily text messages is
The actual number of text messages sent by our 20-year-old in Table 1 is . Our prediction from (c) is . Thus, our prediction error (or residual) is: . Our 20-year-old sent slightly fewer text messages than expected.