EXAMPLE 11 Multiple regression equation, coefficients, and prediction
744
breakfastcereals
The data set Breakfast Cereals includes several predictor variables and one response variable, .
- Use technology to find the multiple regression equation for predicting , using and . State the equation with a sentence.
- State the values of the multiple regression coefficients.
- Interpret the multiple regression coefficients for using and .
- Use the multiple regression equation to predict the rating of a breakfast cereal with 5 mg of fiber and 10 mg of sugar.
When we perform a multiple regression of one variable on (or against or versus) a set of other variables, the first variable is always the variable, and the set of variables following the word on are the variables.
Solution
Using the instructions in the Step-by-Step Technology Guide at the end of this section, we open the Breakfast Cereals data set and perform a multiple regression of on and . Note that this does not represent extrapolation, as there are cereals in the data set that have either zero grams of fiber (such as Cap’n Crunch) or zero grams of sugar (such as Cream of Wheat).
A partial Minitab printout is shown in Figure 20. A partial SPSS printout is in Figure 21. The multiple regression equation is
The estimated nutritional rating equals 52.22 points plus 2.869 times the number of grams of fiber minus 2.246 times the number of grams of sugar.
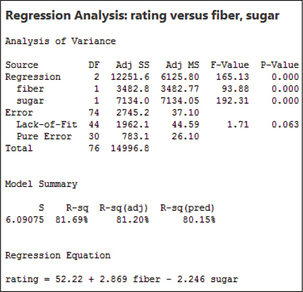 Figure 13.21: FIGURE 20 Multiple regression equation in Minitab.
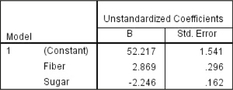 Figure 13.22: FIGURE 21 Multiple regression equation in SPSS.
- The values of the multiple regression coefficients are , , and .
- The multiple regression coefficients are interpreted as follows:
- (y intercept). The estimated nutritional rating when there are zero grams of fiber and zero grams of sugar is 52.22.
- . For every increase of one gram of fiber, the estimated increase in nutritional rating is 2.869 points, when the amount of sugar is held constant.
- . For every increase of one gram of sugar, the estimated decrease in nutritional rating is 2.246 points, when the amount of fiber is held constant.
 When making predictions in multiple regression, beware of the pitfalls of extrapolation, just like those for simple linear regression. Further, in multiple regression, the values for all predictor variables must lie within their respective ranges. Otherwise, the prediction represents extrapolation, and it may be misleading.
745
To find the predicted rating for a breakfast cereal with and , we plug these values into the multiple regression equation from part (a):
The predicted nutritional rating for a breakfast cereal with 5 mg of fiber and 10 mg of sugar is 44.105.
NOW YOU CAN DO
Exercises 9–16.