EXAMPLE 13 F test for the overall significance of the multiple regression
For the breakfast cereal data, we are interested in determining whether a linear relationship exists between y =(nutritional) rating, and x1 =vitamins and x2=sodium .
- Determine whether the regression assumptions have been violated.
- Perform the F test for the overall significance of the multiple regression of rating on vitamins and sodium, using level of significance α = 0.01.
Solution
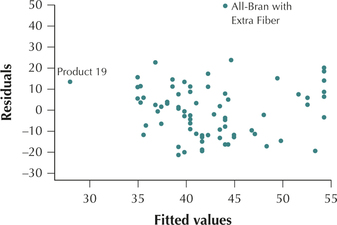
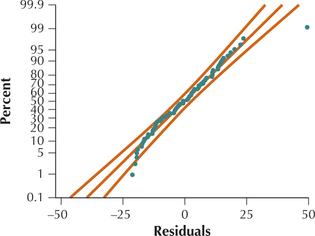
- Figure 22, a scatterplot of the residuals versus fitted values, contains no strong evidence of unhealthy patterns. Although the two cereals, All-Bran with Extra Fiber and Product 19, are unusual, the vast majority of the data suggest that the independence, constant variance, and zero-mean assumptions are satisfied. Figure 23 indicates that the normality assumption is satisfied.
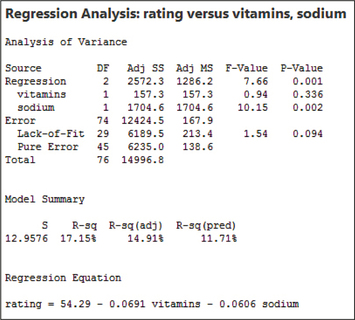
- The Minitab multiple regression results are provided in Figure 24.Page 747
 FIGURE 22 Scatterplots of residuals versus fitted values.
 FIGURE 23 Normal probability plot of the residuals.FIGURE 24 Minitab results for regression of rating on vitamins and sodium.
Step 1 State the hypotheses and the rejection rule. We have k = 2 x variables, so the hypotheses are
- H0 : β1 = β2 = 0. No linear relationship exists between rating and either vitamins and sodium. The overall multiple regression is not significant.
- Ha : and . A linear relationship exists between rating and at least one of vitamins and sodium. The overall multiple regression is significant.
Reject if the .
- Step 2 Find the statistic and the -value. These are located in the ANOVA table portion of the printout, denoted Analysis of Variance. From Figure 24, we have and . The -value represents .
- Step 3 Conclusion and interpretation. The , so we reject . There is evidence, at level of significance , for a linear relationship between rating and at least one of vitamins and sodium. The overall multiple regression is significant.
The ANOVA table is a convenient way to organize a set of statistics, which can be used to perform multiple regression as well as ANOVA.
NOW YOU CAN DO
Exercises 21, 22, 27, and 28.
[Leave] [Close]