EXAMPLE 2 Calculating the residuals and verifying the regression assumptions
For the data in Example 1, do the following:
- Calculate the residuals y−ˆy.
- Verify the regression assumptions.
Solution
- Table 2 contains the x and y data from Table 1, the fitted (predicted) values ˆy, and the residuals y−ˆy.Table 13.3: Table 2 Calculating the residuals
x=Age y=Text messages Fitted (predicted) values ˆy=(−1.5)(age)+60.6
Residuals y−ˆy 18 35 33.6 1.4 20 29 30.6 −1.6 22 27 27.6 −0.6 24 28 24.6 3.4 26 19 21.6 −2.6 28 16 18.6 −2.6 30 19 15.6 3.4 32 12 12.6 −0.6 34 8 9.6 −1.6 36 8 6.6 1.4 - The scatterplot in Figure 5 of the residuals versus fitted values shows no strong evidence of the unhealthy patterns shown in Figure 4. Thus, the independence assumption, the constant variance assumption, and the zero-mean assumption are verified. Also, the normal probability plot of the residuals in Figure 6 indicates no evidence of departures from normality in the residuals. Therefore, we conclude that the regression assumptions are verified.
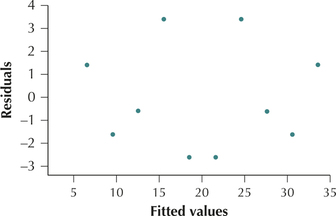 FIGURE 5 Scatterplot of residuals versus fitted values.
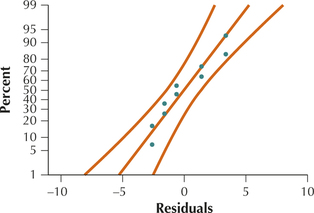 FIGURE 6 Normal probability plot of the residuals.
NOW YOU CAN DO
Exercises 7–14.
[Leave] [Close]