EXAMPLE 3 Calculating tdata
Use the following steps to calculate the test statistic tdata=b1s/√∑(x−ˉx)2 for the data in Table 2:
- Find b1, the slope of the regression line.
- Calculate s, the standard error of the estimate.
- Compute √∑(x−ˉx)2, the numerator of the sample variance of the x data.
Solution
All calculations up to the final result are expressed to nine decimal places.
- From Example 1, the slope of the regression line is b1=−1.5.
Recall from Section 4.3 (page 228) that
s=√SSEn−2=√∑(y−ˆy)2n−2=√∑(residual)2n−2
is the standard error of the estimate. Squaring each residual from Table 2 gives us the squared residuals in Table 3, and the sum of squared residuals, or sum of squares error, equal to
SSE=∑(y−ˆy)2=46.4
Then the standard error of the estimate is
s=√SSEn−2=√46.48≈2.408318916.
Table 13.4: Table 3 Calculating SSEResiduals y−ˆy Squared residuals (y−ˆy)2 1.4 1.96 −1.6 2.56 −0.6 0.36 3.4 11.56 −2.6 6.76 −2.6 6.76 3.4 11.56 −0.6 0.36 −1.6 2.56 1.4 1.96 Sum=46.4 -
s2x=∑(x−ˉx)2n−1
Multiplying each side of the equation by n−1 , we obtain an equation for the quantity ∑(x−ˉx)2:
∑(x−ˉx)2=(n−1)·s2x
The TI-83/84 output from Figure 7 shows that sx=6.055300708 , and, because n=10,
∑(x−ˉx)2= (n−1)· s2x = (9) (6.055300708)2 = 330
Therefore,
tdata = b1s/√∑(x−ˉx)2 = − 1.52.408318916 /√330 ≈ −11.3
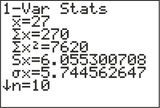 FIGURE 7 Summary statistics for the x (age) data.