EXAMPLE 5 Hypothesis test for the slope β1 using the p-value method and technology
shortmemory
| Time (x) | Score (y) |
|---|---|
| 1 | 9 |
| 1 | 10 |
| 2 | 11 |
| 3 | 12 |
| 3 | 13 |
| 4 | 14 |
| 5 | 19 |
| 6 | 17 |
| 7 | 21 |
| 8 | 24 |
In Section 4.3, we considered a study on short-term memory. Ten subjects were given a set of nonsense words to memorize within a certain amount of time and were later scored on the number of words they could remember. The results are repeated here in Table 4. Use the p-value method and technology to test, using level of significance α = 0.01, whether a linear relationship exists between time and score.
Solution
We begin by verifying the regression assumptions. The scatterplot of the residuals versus the fitted values in Figure 8 shows no strong evidence that the independence assumption, the constant variance assumption, or the zero-mean assumption is violated. Also, the normal probability plot of the residuals in Figure 9 offers evidence of the normality of the results. Therefore, we conclude that the regression assumptions are verified, and proceed with the hypothesis test.
Step 1 State the hypotheses and the rejection rule.
- H0 : β1 = 0 No linear relationship exists between time and score.
- Ha: β1 ≠ 0 A linear relationship exists between time and score.
Page 724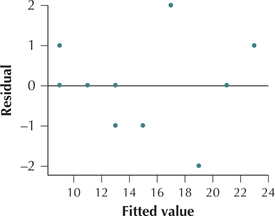 FIGURE 8 Residuals versus fitted values plot.
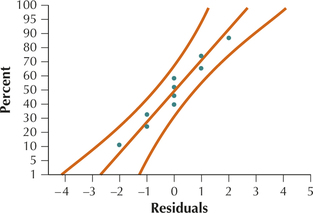 FIGURE 9 Normal probability plot of the residuals.
The rejection rule is: reject H0 if the p-value≤ 0.01.
Step 2 Calculate tdata.
tdata = b1s/√∑(x− ˉx)2
From page 226 in Section 4.3, we have b1= 2. From Example 13 in Chapter 4 on page 228, we have
s= √128 ≈ 1.224744871
From the TI-83/84 summary statistics, we have the standard deviation of the x (time) data to be sx = 2.449489743. Thus, using the relationship we learned in Example 3:
∑(x − ˉx)2= (n − 1) · s2x = (9) 2.4494897432 = 54
Therefore,
tdata = b1s/√∑(x − ˉx)2 ≈ 21.224744871/√54 = 12
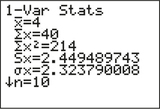 TI-83/84 summary statistics for x (time) data.
Step 3 Find the p-value. For instructions, see the Step-by-Step Technology Guide on page 730. The regression results (including the p-value) for the TI-83/84, Excel, Minitab, and CrunchIt! are shown in Figures 10, 11, 12, and 13. (Differing results are due to rounding.)
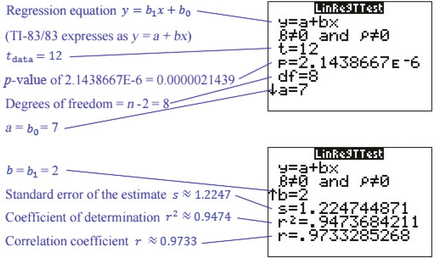 FIGURE 10 TI-83/84 regression results.Page 725
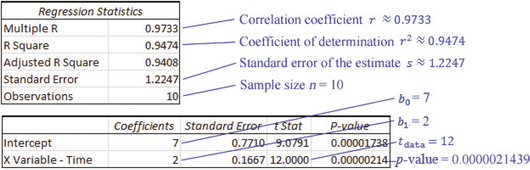 FIGURE 11 Excel regression result.
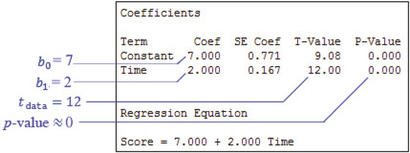 FIGURE 12 Minitab regression results.
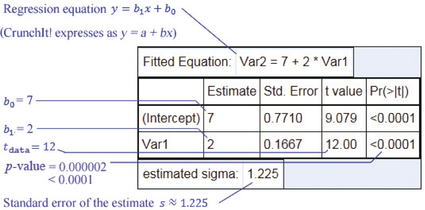 FIGURE 13 Crunchit! regression results.
Step 4 The p-value of about 0.000 is ≤ α = 0.01, so we reject H0. Evidence exists, at level of significance α = 0.01, for a linear relationship between time and score.
NOW YOU CAN DO
Exercises 19–22.