EXAMPLE 8 Constructing and interpreting a confidence interval for the mean value of for a given
Construct and interpret a 95% confidence interval for the population mean number of text messages sent for all 20-year-olds.
Solution
Example 2 showed that the regression assumptions for this data set are met, thus allowing us to construct this confidence interval.
- Using our given value , we calculate the point estimate as follows: .
- The data set in Table 1 shows that there are people, so that the degrees of freedom for the critical value is . From the table (Table D in the Appendix), the critical value for confidence level 95% is .
- In Example 3, we calculated and the standard error of the estimate to be .
The Minitab output in Figure 17 shows that years of age.
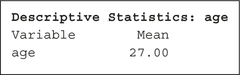 Figure 13.18: FIGURE 17 Minitab shows .
Thus,
We are 95% confident that the number of text messages sent by a randomly selected 20-year-old lies between 24.3947 and 36.8053.
 Extrapolation (page 215) continues to be a danger for confidence intervals and prediction intervals. For example, it would not have been wise to ask for a confidence interval for the population mean number of text messages sent by all 50-year-old people because lies outside the range of .
NOW YOU CAN DO
Exercises 3–8.