Figure 13.23:
FIGURE 22
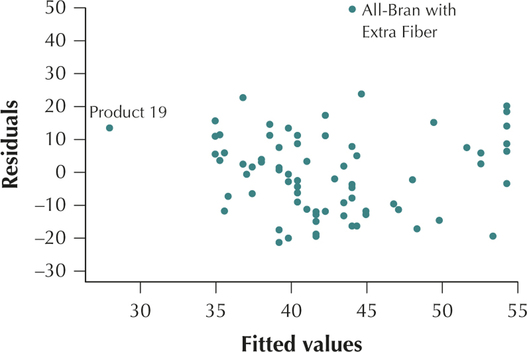
Scatterplots of residuals versus
fitted values
.