Figure 13.28:
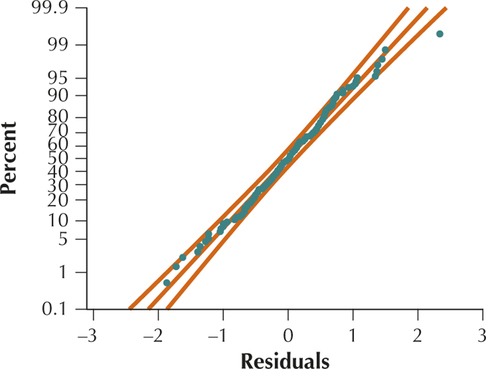
FIGURE 27
Normal
probability
plot of the residuals.