For Exercises 7–14, you are given the regression equation.
- Calculate the predicted values.
- Compute the residuals.
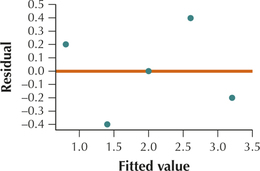
- Construct a scatterplot of the residuals versus the predicted values.
- Use technology to construct a normal probability plot of the residuals.
- Verify that the regression assumptions are valid.
Question 13.13
13.
| 1 | 1 |
| 2 | 1 |
| 3 | 2 |
| 4 | 3 |
| 5 | 3 |
13.1.13
(a) and (b)
| 1 | 1 | 0.8 | 0.2 |
| 2 | 1 | 1.4 | –0.4 |
| 3 | 2 | 2 | 0 |
| 4 | 3 | 2.6 | 0.4 |
| 5 | 3 | 3.2 | –0.2 |
(c)
(d)
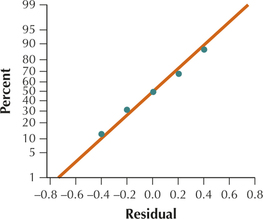
(e) The scatterplot in (c) of the residuals versus fitted values shows no strong evidence of unhealthy patterns. Thus, the independence assumption, the constant variance assumption, and the zero-mean assumption are verified. Also, the normal probability plot of the residuals in (d) indicates no evidence of departure from normality of the residuals. Therefore we conclude that the regression assumptions are verified.