EXAMPLE 1 Conditions for parametric test are not met

Since 1940, the National Weather Service has reported the annual number of hurricane-related deaths in the United States. Here is a random sample size from the population of yearly hurricane deaths:
| Year | 1959 | 1963 | 1974 | 1988 | 1999 | 2001 | 2005 | 2010 |
| Deaths | 24 | 11 | 1 | 9 | 19 | 24 | 1016 | 13 |
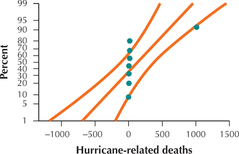
We are interested in testing whether the population mean number of hurricane-related deaths is less than 25. Figure 1 is the normal probability plot for the data. Determine whether the conditions required for the one-sample test are met.

Solution
The test may be used if the population is normal or if the sample size is at least 30. The normal probability plot shows two data values outside the bounds, indicating that the data are not normally distributed. Also, the sample of size is not at least 30. Therefore, the conditions for performing the test for the population mean are not met. (The unusual data value of 1016 hurricane-related deaths for 2005 is the result of Hurricanes Katrina and Rita.)