EXAMPLE 10 Wilcoxon signed rank test for matched-pair data

Use the data from Example 9 to test whether the population median number of enrolled students has decreased from 2013 to 2014, using level of significance .
Solution
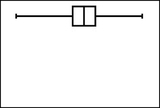
Figure 11 is a TI-83/84 boxplot of the differences (2014 – 2013). The whiskers are approximately the same length, indicating symmetry. Thus, we have a random sample of data exhibiting acceptable symmetry, and so our conditions are met.
Step 1 State the hypotheses. We have a left-tailed test:
where represents the population median of the differences in number of enrolled students at California community colleges from 2013 to 2014.
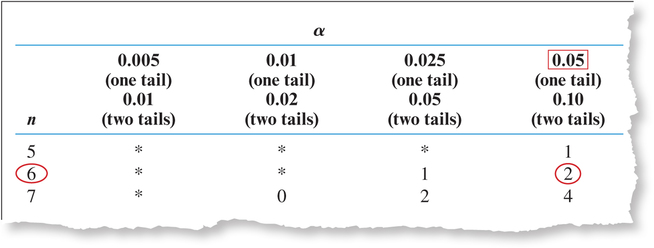
- Step 2 Find the critical value and state the rejection rule. The sample size is the number of data values for which the difference does not equal zero. Because none of the differences equals zero, our sample size is . Because , we use the small-sample case. To find the critical value, we use Appendix Table J. We have a one-tailed test, with level of significance and , which gives us , as shown in Figure 12. The rejection rule is to reject if .
Step 3 Find the value of the test statistic. The signed ranks are given in Table 7. We have a left-tailed test, so from Table 9, we have
14-23
 Figure 14.12: FIGURE 12 Finding the critical value .
- Step 4 State the conclusion and the interpretation. Because is not ≤2, we do not reject . The evidence is insufficient to conclude that the population median number of students enrolled at California community colleges has decreased from 2013 to 2014.
NOW YOU CAN DO
Exercises 15–18.