EXAMPLE 12 Large-sample Wilcoxon signed rank test for a population median using technology
Test using level of significance whether the population median age of missing children differs from 6 years old, using the random sample of 50 missing children shown here:
| Child | Age | Child | Age | Child | Age | Child | Age |
|---|---|---|---|---|---|---|---|
| Amir | 5 | Carlos | 7 | Octavio | 8 | Christian | 8 |
| Yamile | 5 | Ulisses | 6 | Keoni | 6 | Mario | 8 |
| Kevin | 5 | Alexander | 7 | Lance | 5 | Reya | 5 |
| Hilary | 8 | Adam | 4 | Mason | 5 | Elias | 1 |
| Zitlalit | 7 | Sultan | 6 | Joaquin | 6 | Maurice | 4 |
| Aleida | 8 | Abril | 6 | Adriana | 6 | Samantha | 7 |
| Alexia | 2 | Ramon | 6 | Christopher | 3 | Michael | 9 |
| Juan | 9 | Amari | 4 | Johan | 6 | Carlos | 2 |
| Kevin | 2 | Joliet | 1 | Kassandra | 4 | Lukas | 4 |
| Hazel | 5 | Christopher | 4 | Hiroki | 6 | Kayla | 4 |
| Melissa | 1 | Jonathan | 8 | Kimberly | 5 | Aiko | 3 |
| Kayleen | 6 | Emil | 7 | Diondre | 4 | Lorenzo | 9 |
| Mirynda | 7 | Benjamin | 5 |
Solution
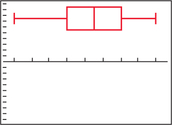
The boxplot of the age data is shown here.

The conditions are met because we have a random sample and the distribution of ages is symmetric.
Step 1 State the hypotheses.
where represents the population median age of the missing children.
- Step 2 Find the critical value and state the rejection rule. There are 50 children. Ten of these children are 6 years old, so that . These 10 children are therefore omitted from this hypothesis test. This leaves us with 40 children, which is greater than 30, so we use the large-sample case. From Table 4 in Chapter 9 (page 500), the two-tailed test with level of significance gives us . We will reject if .
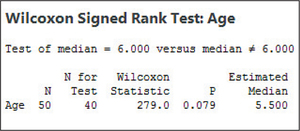
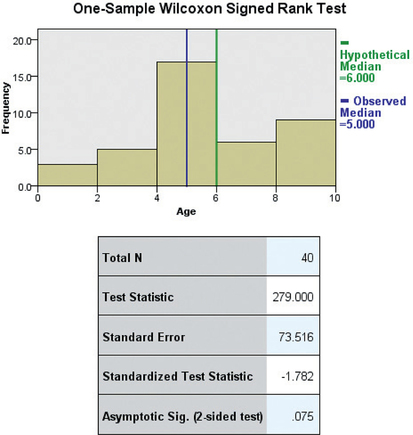
Step 3 Find the value of the test statistic. We use the instructions provided in the Step-by-Step Technology Guide at the end of this section. Figure 14 shows the Minitab results, and Figure 15 shows the SPSS results, from the Wilcoxon signed rank test for the population median. Note that the original sample size (“N”) is 50, but that “N for Test” is , because 10 data values have been omitted. The “Wilcoxon Statistic” is the value of , which represents the smaller of and . We use this value to find the test statistic:
14-26
 Figure 14.14: FIGURE 14 Minitab output for the Wilcoxon signed rank test for a population median.
 Figure 14.15: FIGURE 15 SPSS output for the Wilcoxon signed rank test for a population median.
- Step 4 State the conclusion and the interpretation. Because , we reject . There is evidence that the population median age of the missing children differs from 6 years old. Acquiring more data has changed our conclusion.