EXAMPLE 22 Using rank correlation to detect a nonlinear pattern
scrabble
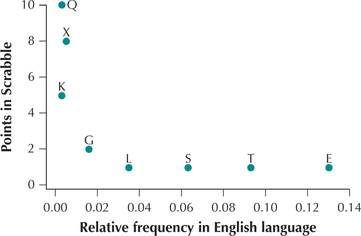
In the Chapter 13 Case Study, “How Fair Is the Scoring in Scrabble?” we noted from a scatterplot of Scrabble point values versus English-language letter frequencies that the relationship between the variables was not linear. Thus, we could not use a linear regression analysis. However, we can use rank correlation to test whether the two variables are associated, because linearity is not a condition for applying the rank correlation test.
For the following random sample of letters, use the rank correlation test to investigate whether an association exists between English-language frequencies and Scrabble point values. Use level of significance α=0.05. Note from Figure 24 that the relationship between the variables is certainly nonlinear.
| Letter | Frequency | Scrabble points |
|---|---|---|
| Q | 0.003 | 10 |
| L | 0.035 | 1 |
| G | 0.016 | 2 |
| E | 0.130 | 1 |
| X | 0.005 | 8 |
| T | 0.093 | 1 |
| S | 0.063 | 1 |
| K | 0.003 | 5 |

Solution
The data come from a random sample, so we may proceed with the hypothesis test.
- Step 1 State the hypotheses.
- H0:No rank correlation exists between language frequency and Scrabble points.
- Hα:A rank correlation exists between language frequency and Scrabble points.
- Step 2 Find the critical value and state the rejection rule. There are n=8 letters in the random sample, so we apply the small-sample case (n≤30). Using Appendix Table K, we select the column with level of significance α=0.05 and the row with n=8. Our critical value is rcrit=0.738. We will reject H0 if rdata≥0.738 or if rdata≤−0.738.
- Step 3 Find the value of the test statistic. See Table 17.Table 14.78: Table 17 Table of calculations to find ∑d2
Letter Frequency Scrabble
pointsFrequency
rankScrabble
rankDifference d
d2 Q 0.003 10 1.5 8 −6.5 42.25 L 0.035 1 5 2.5 2.5 6.25 G 0.016 2 4 5 −1 1 E 0.130 1 8 2.5 5.5 30.25 X 0.005 8 3 7 −4 16 T 0.093 1 7 2.5 4.5 20.25 S 0.063 1 6 2.5 3.5 12.25 K 0.003 5 1.5 6 −4.5 20.25 ∑d2=148.5 There are n=8 letters in the sample, so the value of the test statistic is given by
rdata=1−6Σd2n(n2−1)=1−6(148.5)8(63)≅−0.7679
- Step 4 State the conclusion and the interpretation. Because −0.7679≤−0.738, we reject H0. There is evidence for a rank correlation between the frequency of letters in the English language and the number of points each letter is worth in the game of Scrabble. Because rdata is negative, the relationship is also negative. That is, high point values are associated with low frequency in English, and vice versa.