EXAMPLE 3 Small-sample sign test for the population median
For the data from Example 2, use the sign test to determine whether the population median M number of hurricane-related deaths per year is less than 50, using level of significance α=0.05.
Solution
From Example 1, we know that the data come from a random sample, which is the only condition for conducting the sign test. Thus, we may proceed.
Step 1 State the hypotheses. the hypotheses are
H0:M=50versusHα:M<50
where M represents the population median number of hurricane-related deaths per year.
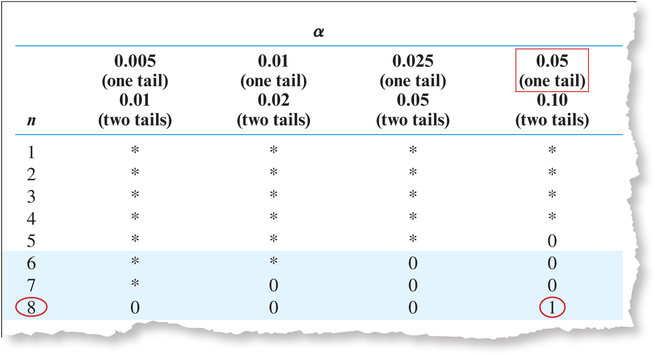
Step 2 Find the critical value and state the rejection rule. The total number of plus signs and minus signs is n=7+1=8, which is not greater than 25, so we use the small-sample case. We have a one-tailed test, with α=0.05 and n=8, which gives us Scirt=1 (Figure 2). The rejection rule is to reject H0 if Sdata≤1.
 FIGURE 2 Using Appendix Table I to find the critical value Scirt.
Step 3 Find the value of the test statistic. We have a left-tailed test, and so, from Table 3, our test statistic is
Sdata=number of plus signs=1
Page 14-9Step 4 State the conclusion and the interpretation. The value of our test statistic is Sdata=1, which is ≤1, so we reject H0. Evidence exists that the population median number of hurricane-related deaths is less than 50 per year.
NOW YOU CAN DO
Exercises 9–16.