EXAMPLE 6 The sign test using the -value method
education
The following data set represents the education receipts (such as taxes) and the education expenditures for a random sample of 10 states. Test, using level of significance , whether the population median of the differences (receipts − expenditures) per state differs from zero.
14-12
| State | Receipts ($ millions) |
Expenditures ($ millions) |
Difference |
|---|---|---|---|
| Florida | 28,208 | 26,832 | 1,376 |
| California | 73,272 | 68,045 | 5,227 |
| New Jersey | 20,032 | 19,938 | 94 |
| Alabama | 7,000 | 6,540 | 460 |
| Minnesota | 10,280 | 10,191 | 89 |
| Indiana | 11, 9 9 6 | 11, 315 | 681 |
| Maine | 2,458 | 2,458 | 0 |
| New York | 41,800 | 42,895 | −1,095 |
| Mississippi | 4,3 41 | 3,945 | 396 |
| Ohio | 24,259 | 21,237 | 3,022 |
Table 14.8: Source: National Education Association.
Solution
The states represent a random sample of matched-pair data. We may thus proceed with the sign test for the population median of the differences.
Step 1 State the hypotheses.
where represents the population median of the differences in education receipts minus expenditures per state.
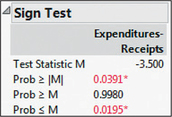
- Step 2 Find the -value using technology. We use the instructions provided in the Step-by-Step Technology Guide at the end of this section. The Minitab output shown in Figure 4 and the JMP output shown in Figure 5 provide the -value for this hypothesis test: . Note that one state (Maine) has education receipts equal to expenditures, so that the difference for Maine equals zero. Maine is thus omitted, and the -value is based on the other nine states left in the sample.
 Figure 14.4: FIGURE 4 Minitab output for the sign test for the population median.
 Figure 14.5: FIGURE 5 JMP output for the sign test for the population median.
 - Step 3 State the conclusion and the interpretation. The -value 0.0391 is less than the level of significance , so we reject . Evidence exists that the population median difference between education receipts and expenditures differs from zero.